GHM (Graham Corp) Market Value to Book Value Ratio

Official company branding of graham-mfg.com (GHM)

High barriers to entry in the vacuum systems niche for the nuclear fleet and strict US Navy requirements keep the market closed to new players. This chart confirms the current trend, with the key indicator standing at 4.35. Graham Corporation (GHM) relies on external supplies of castings and electronics for turbomachinery assembly. The company is currently mitigating petrochemical sector risks by increasing the number of long-term orders for heat exchangers.

Graham Industrial (GHM) - Market Capitalization to Book Value Ratio from 07/04/2022 to 10/28/2026
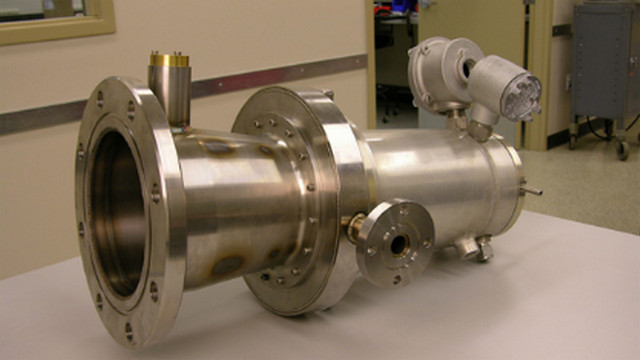
Signature product of Graham Corp.

This indicator reflects the gap between the market price of shares and the actual value of net assets, reacting sensitively to any changes in operating capital. High price-to-book ratios for Graham Corporation (GHM) are justified by unique certifications in the nuclear sector and the US defense industry, which create a long-term defensive moat and justify a premium business valuation by investors.

Direct competitors

Market Capitalization to Book Value Ratio CAT|GEV (gevernova.com) - Market-to-Book Ratio|Lam Research Corporation - Market Value to Book Value Ratio|Market Value to Equity Ratio United Rentals Inc (URI)|Market Cap to Net Assets Ratio GWW|Market Capitalization to Book Value Ratio Westinghouse Air Brake Technologies Corporation (WAB)|Market Capitalization to Book Value Ratio RBA|chartindustries.com - Market Capitalization to Book Value|Market Value to Book Value Ratio Oshkosh|FSS: Market Capitalization to Net Assets|GTES (Gates) - Market Value to Book Value Ratio|Herc Corp (HRI) - Market Cap to Net Assets Ratio|Market Capitalization to Book Value Ratio TEX (Terex Corporation)|Market-to-Book Ratio HI|Market Value to Book Value Ratio China Yuchai International Limited CYD|Capitalization to Book Value Ratio The Greenbrier Companies GBX|Market Cap to Net Assets Ratio Custom Truck (CTOS)|GRC - Market Cap to Book Value Multiple|Market Cap to Net Assets Ratio Astec Industries, Inc. (ASTE)|AEBI - Market Value to Book Value|Market Capitalization to Book Value Ratio Douglas Dynamics PLOW|Northwest Pipe Co. (NWPX) - Market Value to Book Value|Market Capitalization to Book Value Ratio MLR (Miller Industries Towing)|Market-to-Book Ratio manitowoc.com|Market Capitalization to Book Value Ratio ALTG|Market Capitalization to Book Value Ratio gencor.com GENC|Market Cap to Net Assets Ratio Twin Disc TWIN|CODA - Market Value to Book Value Ratio|HLP (Hongli Group, Inc.) - Market Cap to Net Assets Ratio|BWEN - Market-to-Book Ratio|Market Capitalization to Book Value Ratio RVSN (Rail Vision Ltd.)|TLIH (ten-league.com.sg) - Market Value to Equity Ratio|CLWT - Market Value to Book Value Ratio|Market Value to Book Value Multi Ways Holdings Ltd.|Market Capitalization to Book Value Ratio VEEE|Market Capitalization to Book Value Ratio Vision Marine Corp (VMAR)|Market Capitalization to Book Value Ratio H&E Equipment Services, Inc.|Market Value to Book Value manitexinternational.com MNTX|Heramba Electric - Market Capitalization to Book Value Ratio|TPIC: Market Capitalization to Book Value Ratio|AEBIV (aebi‑schmidt.com) - Market Value to Book Value Ratio