Graham Industrial (GHM) Price to Earnings Multiple

Corporate emblem and logo of Graham Manufacturing (GHM)

Integration into the US defense complex and the rise of global threats provide Graham Corporation (GHM) with reliable government contracts. The company's P/E dynamics confirm this trend, where 74.10 represents the current level of the metric. The business relies on the production of heat exchange systems for nuclear power and the navy, although revenue volatility persists due to long capital expenditure cycles for complex projects.

GHM: graham-mfg.com Price to Earnings Ratio 07/04/2022 - 11/14/2026

Comprehensive metric breakdowns and analytics for Graham Corp. (GHM)
- market price and analyst price targets:
Summary company analysis:GHM, graham-mfg.com
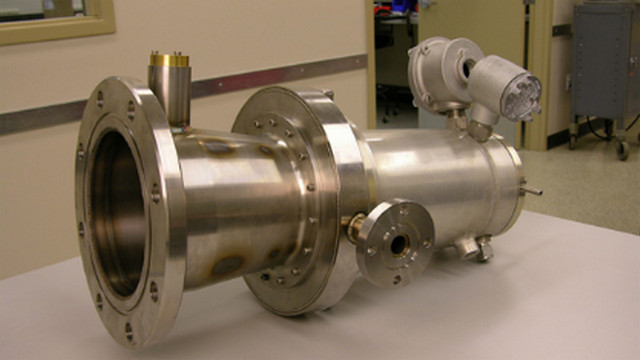
Flagship merchandise of Graham Corp

Graham Corporation's recurring government contracts for vacuum equipment ensure stable capacity utilization, which directly impacts net income dynamics. By analyzing the company's price-to-earnings ratio, an investor assesses the cost of one dollar of profit relative to market capitalization to determine the premium paid for the asset. Low values for this indicator confirm the business is undervalued and highlight the high reliability of the investment ahead of a potential rise in share prices.

Competing companies

Market Cap to Earnings Caterpillar Corp. CAT|Price to Earnings Ratio GE Vernova (GEV)|Lam - Price to Earnings Multiple|United Rentals Corp - Price to Earnings Ratio|Market Price to Net Income Ratio GWW (W.W. Grainger Inc)|WAB: Price to Earnings Ratio|Company Value to Net Income RBA (ritchiebros.com)|GTLS: P/E Multiple|Oshkosh Corp - Company Value to Net Income|FSS (Federal Signal Safety) - P/E Multiple|Market Cap to Earnings Gates Corp GTES|P/E Multiple HRI|P/E Multiple terex.com (TEX)|Hillenbrand - Price to Earnings Ratio|China Yuchai - Price to Earnings Ratio|GBX: Price to Earnings Ratio|Market Cap to Earnings Custom Truck Corp|GRC: P/E Multiple|Market Cap to Net Income Ratio astecindustries.com ASTE|Price to Earnings Ratio Aebi Schmidt|PLOW: Company Value to Net Income|P/E Multiple NWPX|P/E Multiple Miller Industries Corp (MLR)|P/E Multiple MTW (The Manitowoc Company)|Company Value to Net Income ALTG|Gencor Industries Inc - P/E Multiple|TWIN - P/E Multiple|codaoctopusgroup.com (CODA) - Price to Earnings Ratio|Price to Earnings Ratio Hongli Group Corporation|Price to Earnings Ratio BWEN|RVSN: Company Value to Net Income|P/E Multiple TLIH|Price to Earnings Ratio euro-tech.com CLWT|Price to Earnings Ratio Multi Ways Holdings Ltd MWG|Twin Vee Powercats Co (VEEE) - Market Cap to Earnings|VMAR - Price to Earnings Ratio|Company Value to Net Income HEES (H&E Equipment Services)|Manitex (MNTX) - Price to Earnings Ratio|Market Cap to Net Income PITA (Heramba Electric PLC)|Price to Earnings Ratio TPI Composites, Inc|Market Cap to Earnings Aebi Schmidt Group AEBIV