MNTX Manitex International: Market Capitalization to Book Value Ratio
Manitex International Inc (MNTX) - corporate logo

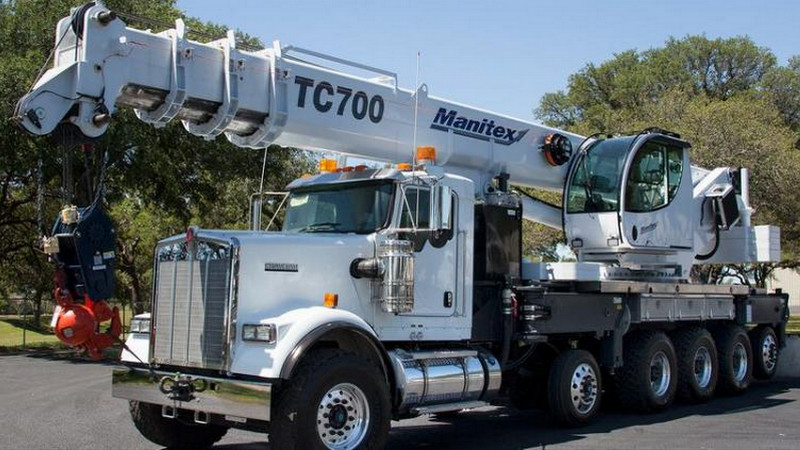
Complex oversized crane delivery increases supply chain costs, which is confirmed by the change in the market-to-book value ratio on the balance sheet. The value 1.59 indicates the level of this metric. Manitex International (MNTX) relies on an impeccable B2B image and customer loyalty. The stability of global shipments is based on a network of plants in Germany, Italy, and the US.

manitexinternational.com - MNTX Market Value to Equity Ratio (period 07/04/2022 - 01/11/2025)
Manufactured products of Manitex International Inc

The ratio is calculated as the quotient of the market capitalization divided by the net asset value. This metric determines the premium investors are willing to pay for control over tangible assets. High confidence in the reliability of Manitex International cranes typically supports a brand value that exceeds balance sheet figures. Analyzing the market's revaluation coefficient of balance sheet capital helps identify hidden risks of asset undervaluation. This chart's price action helps a strategic buyer accurately determine the business value.

Competitor analysis

Market Cap to Net Assets Ratio caterpillar.com|gevernova.com (GEV) - Capitalization to Book Value Ratio|Market Capitalization to Book Value Ratio LRCX (Lam Research Corporation)|Market-to-Book Ratio URI|GWW: Market Value to Book Value Ratio|Market Value to Equity Ratio Westinghouse Air Brake Technologies Corporation WAB|Market Cap to Net Assets Ratio RBA (RB Global, Inc.)|Market Capitalization to Book Value Ratio chartindustries.com GTLS|Market Capitalization to Book Value Ratio OSK (Oshkosh)|FSS: Market Capitalization to Book Value|Market Value to Book Value Ratio Gates (GTES)|HRI (Herc Corp) - Market Capitalization to Net Assets|Market Value to Book Value Ratio TEX|Market Cap to Net Assets Ratio hillenbrand.com|China Yuchai International Limited - Market Capitalization to Book Value Ratio|Market-to-Book Ratio GBX (The Greenbrier Companies)|CTOS - Market Value to Book Value Ratio|GRC - Capitalization to Book Value Ratio|Market Cap to Net Assets Ratio Astec Industries, Inc. ASTE|aebi-schmidt.com (AEBI) - Market Cap to Book Value Multiple|Market Cap to Net Assets Ratio Douglas Dynamics PLOW|Graham Manufacturing (GHM) - Market Value to Book Value|NWPX - Market Capitalization to Book Value Ratio|Market Value to Book Value Miller Industries Corp|Manitowoc - Market Capitalization to Book Value Ratio|Market-to-Book Ratio altaequipment.com (ALTG)|Market Capitalization to Book Value Ratio GENC (Gencor Industries)|TWIN - Market Capitalization to Book Value Ratio|CODA - Market Cap to Net Assets Ratio|Hongli Group Corporation (HLP) - Market Value to Book Value Ratio|Market Cap to Net Assets Ratio BWEN|RVSN (railvision.io) - Market-to-Book Ratio|Market Value to Book Value Ratio TLIH|Market Cap to Net Assets Ratio Euro Tech Holdings Co. Ltd.|Market Capitalization to Book Value Ratio MWG|Market Capitalization to Book Value Ratio VEEE (twinvee.com)|VMAR - Market Value to Book Value Ratio|Capitalization to Book Value Ratio H&E Equipment Services Inc. HEES|Market Capitalization to Book Value Ratio PITA (Heramba Electric)|TPI Composites Inc. (TPIC) - Market Capitalization to Book Value|AEBIV - Market Cap to Net Assets Ratio