Good Times Restaurants Inc. (GTIM): Net Sales Margin

Good Times - graphic logo of issuer GTIM

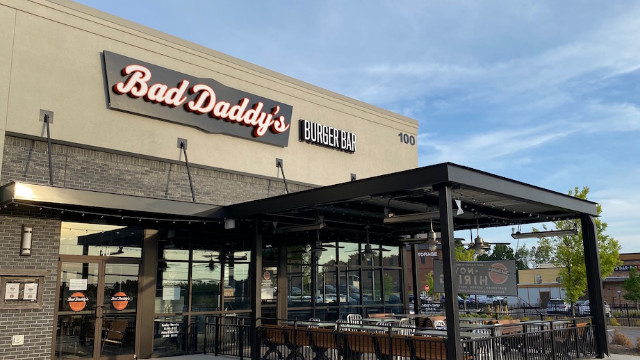
Good Times Restaurants (GTIM) maintains resilient liquidity and stable working capital. The aggressive expansion of the Bad Daddy's Burger Bar chain through new location openings is extending the brand's market influence. Cost optimization is achieved via franchising and logistics outsourcing. The commercial profitability level illustrates the yield dynamics, while the 1.60 metric confirms the current level of sales efficiency.

Good Times Restaurants (GTIM) Net Margin: for the period 07/04/2022 - 11/19/2026

Comprehensive metric breakdowns and analytics for Good Times Restaurants (GTIM)
- share price and expert price forecast:
Summary company analytics:Good Times Restaurants, GTIM
Flagship merchandise of Good Times

Sales margin measures the share of net profit in every dollar of revenue, determining the overall efficiency of the business. The value of 1.60 directly depends on the company's ability to optimize costs. By analyzing the return on sales via net profit, an investor identifies risks of capital depreciation. For Good Times Restaurants (GTIM), this indicator reflects the success of supply chain control and the performance of the digital ecosystem. High customer loyalty through the app stabilizes this metric.

Competitor analysis for Good Times Restaurants

McDonalds (MCD) - Net Margin|Net Profitability Margin Starbucks Coffee SBUX|CMG (Chipotle Mexican Grill Inc) - Net Sales Margin|Net Sales Margin Yum Brands Inc|Net Margin sysco.com (SYY)|Company Sales Margin rbi.com|Net Sales Margin DRI (Darden Restaurants Inc)|Net Sales Margin Toast Inc TOST|usfoods.com - Net Sales Margin|Net Profit Rate YUMC (Yum China Inc.)|Domino's Pizza (DPZ) - Net Margin|TXRH - Company Sales Margin|Net Margin Aramark Corporation|BROS: Net Profit Rate|Net Margin CAVA Group Inc (CAVA)|WING - Net Margin|Net Sales Margin MIDD (The Middleby)|Company Sales Margin brinker.com (EAT)|shakeshack.com - Net Sales Margin|Company Sales Margin The Cheesecake Factory Incorporated CAKE|WEN (Wendy's Corp) - Return on Sales by Net Profit|Net Margin Olo Corp (OLO)|Return on Sales by Net Profit PZZA|Net Return on Sales ARCO (McDonald's Latin America)|Net Sales Margin BRCB|HDL - Net Margin|Net Sales Margin CBRL (crackerbarrel.com)|Company Sales Margin Sweetgreen Restaurants (SG)|First Watch Corp - Net Sales Margin|Company Sales Margin Biglari Holdings BH|KRUS (Kura Sushi USA) - Return on Sales by Net Profit|Net Profit Margin PLAY (Dave & Buster's Entertainment, Inc.)|Return on Sales by Net Profit BJRI|Bloomin' Corp (BLMN) - Company Sales Margin|Return on Sales by Net Profit DNUT (krispykreme.com)|Company Net Profitability PBPB|Net Sales Margin KRT (Karat Packaging Inc)|Portillo's Hot Dogs (PTLO) - Net Margin|Dine Brands Global Inc - Net Sales Margin|Jack in the Box Inc. (JACK) - Return on Sales by Net Profit|El Pollo Loco (LOCO) - Net Margin|Net Margin dennys.com (DENN)|Return on Sales by Net Profit TWNP|MasterBeef (MB) - Company Sales Margin|Net Sales Margin RRGB|GENK - Net Margin|Net Sales Margin STKS (togrp.com)|flanigans.net - Net Margin|Rave Restaurant Group - Net Sales Margin|Net Profit Rate FAT (fatbrands.com)|GIFT: Net Sales Margin|NDLS (Noodles & Company, Inc.) - Net Margin|Net Margin Ark Restaurants Corporation|Net Margin yoshiharuglobal.com VSTD|Return on Sales by Net Profit LBGJ (Li Bang International Corp Inc.)|Net Margin HWH (HWH International Inc)|Net Sales Margin PC (Premium Catering Holdings Limited)|Company Net Profitability BTBD (BT Brands, Inc)|HCHL: Return on Sales by Net Profit|Company Sales Margin BurgerFi International BFI|CHUY (Chuy's) - Return on Sales by Net Profit|Sushi Ginza Onodera (ONDR) - Net Sales Margin|PNST (Pinstripes Inc.) - Net Sales Margin|Presto Automation Inc (PRST) - Company Sales Margin|Net Sales Margin YOSH|Net Margin TWNPV (Twin Hospitality Group)