GTIM: Good Times Burgers Price-to-Revenue Coefficient

Symbol and logo of brand Good Times Burgers (GTIM)

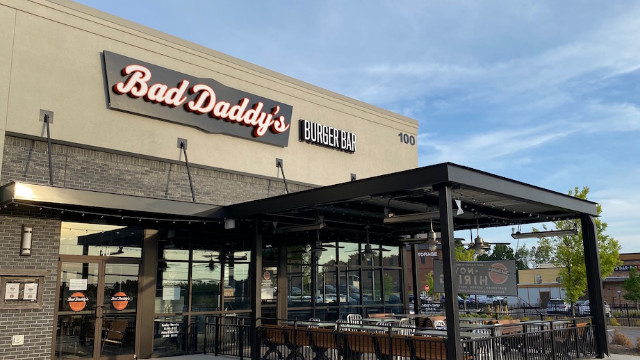
Good Times Restaurants (GTIM) is expanding its Bad Daddy’s Burger Bar chain, offering premium burgers at affordable prices. GURU.Markets provides this price-to-sales chart, where the 0.10 mark indicates the market valuation of revenue. The company is implementing eco-friendly packaging to combat waste, while its ownership of Mexican grill cafes diversifies profit streams and mitigates consumer risks.

GTIM (Good Times Restaurants) P/S Multiple history from 07/04/2022 to 11/13/2026

Metric breakdowns and analytics for Good Times Burgers (GTIM)
Fundamental company analysis:GTIM - goodtimesburgers.com
Manufactured product of Good Times Restaurants Inc.

The P/S multiple determines the market value of one dollar of annual revenue, reflecting the investment valuation of the business scale. Analyzing the price-to-sales ratio on the GURU.Markets platform reveals how cost inflation in the US is weighing on the operational efficiency of Good Times Restaurants (GTIM). The dynamics of this coefficient identify whether the asset is overvalued or undervalued. A rational balance of this metric confirms the resilience of the capitalization to macroeconomic shocks.

Competing companies

MCD (corporate.mcdonalds.com) - Market Capitalization-to-Revenue Ratio|P/S Multiple SBUX (Starbucks)|Price-to-Revenue Coefficient Chipotle Mexican Grill, Inc. (CMG)|YUM - Price-to-Revenue Ratio|SYY (Sysco Corp.) - Market Cap to Revenue Ratio|QSR: P/S Multiple|Price-to-Revenue Multiple darden.com DRI|TOST (Toast) - P/S Multiple|USFD - Price-to-Revenue Multiple|Price-to-Revenue Ratio Yum China Inc. (YUMC)|DPZ - Price to Sales|Price-to-Revenue Ratio Texas Roadhouse, Inc. TXRH|aramark.com (ARMK) - Price to Sales|Dutch Bros - P/S Multiple|CAVA (CAVA Group, Inc.) - Market Cap to Revenue Ratio|WING (Wingstop Inc) - Market Cap to Revenue|Middleby Marshall - Market Capitalization-to-Revenue Ratio|Market Cap to Revenue EAT|SHAK (shakeshack.com) - Market Cap to Sales Volume|P/S Multiple CAKE|Price-to-Revenue Coefficient Wendy's Company|Price-to-Revenue Ratio Olo Platform OLO|PZZA - Market Cap to Revenue|McDonald's Latin America - P/S Multiple|Price to Sales br.coffee|Super Hi International Holding Ltd. (HDL) - Price-to-Revenue Ratio|CBRL - Price-to-Revenue Coefficient|Market Cap to Revenue SG|FWRG: Market Capitalization-to-Revenue Ratio|Price-to-Revenue Ratio Biglari Holdings Inc. (BH)|KRUS (kurasushi.com) - Market Capitalization-to-Revenue Ratio|P/S Multiple PLAY (Dave & Buster's Entertainment)|BJ's Restaurants Inc (BJRI) - Price to Sales|BLMN - Price-to-Revenue Ratio|Price-to-Revenue Coefficient Krispy Kreme Corp DNUT|PBPB (Potbelly Corporation) - Market Cap to Revenue|KRT: Market Cap to Sales Volume|PTLO (Portillo's) - P/S Multiple|P/S Multiple IHOP|Market Cap to Revenue JACK (Jack in the Box Corp)|P/S Multiple El Pollo Loco Holdings Inc. (LOCO)|Price-to-Revenue Ratio Denny's Corporation DENN|Market Capitalization-to-Revenue Ratio TWNP|MasterBeef - P/S Multiple|RRGB - P/S Multiple|GEN Korean BBQ (GENK) - Price-to-Revenue Ratio|Market Cap to Revenue Ratio STKS|Market Cap to Revenue BDL|RAVE (Rave Restaurant Group) - Market Cap to Sales Volume|Price-to-Revenue Ratio FAT Brands Inc. (FAT)|Price-to-Revenue Coefficient Giftify Inc.|P/S Multiple NDLS (Noodles & Company, Inc.)|Price-to-Revenue Multiple Ark Restaurants Corp|VSTD: Market Cap to Revenue|Li Bang International Corp Inc - Market Cap to Sales Volume|HWH: P/S Multiple|PC - Price-to-Revenue Coefficient|Price-to-Revenue Ratio BT Brands, Inc|Market Cap to Revenue Happy City (HCHL)|Price-to-Revenue Ratio BurgerFi International (BFI)|CHUY: Price-to-Sales Ratio|Sushi Ginza Onodera - Market Cap to Revenue|P/S Multiple Pinstripes Holdings, Inc. PNST|Presto Automation Inc - P/S Multiple|YOSH: Price-to-Revenue Ratio|Twin Hospitality Group (TWNPV) - Price-to-Revenue Ratio