Year-over-year earnings per share growth for the last twelve months: Humacyte (HUMA)

Exclusive patents for vascular implants and stringent FDA oversight create a powerful barrier to entry for competitors, as illustrated by the quarterly EPS change. This chart demonstrates profit dynamics, where 35.00 represents the current metric. Growth is driven by government contracts and the approval of HAV vessels, while stable management focuses on the final stages of certification for unique biotechnologies for Humacyte, Inc. (HUMA).

HUMA (Humacyte Inc.): analytical breakdowns and indicator data
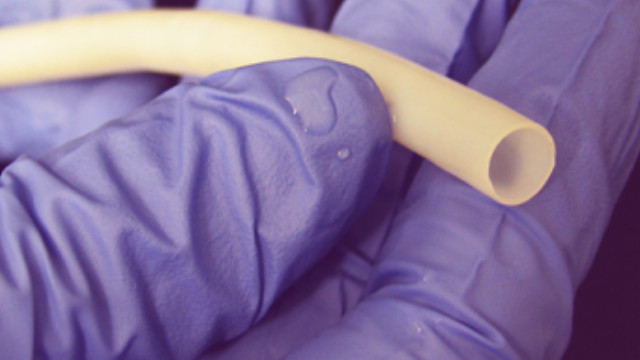
Quarterly EPS growth measures the rate of change in net income per share relative to the same period last year. By analyzing quarterly earnings per share dynamics, an investor identifies hidden stagnation or an acceleration in business profitability. This metric is sensitive to operating expenses and sales volume, signaling whether an asset is overvalued. For Humacyte, Inc. (HUMA), this indicator depends critically on FDA approval. Obtaining the license will ensure a commercial launch and a sharp reversal in profitability.
