HUMA: Humacyte Inc P/E Multiple

The regenerative medicine sector operates independently of global economic fluctuations, serving as a stable defensive asset due to the constant interest in scientific research. This PE chart for Humacyte, Inc. (HUMA) captured a metric of -1.30, while tissue engineering requires strict sterility and the automation of bioreactors under expert supervision. Humacyte, Inc. (HUMA) supplies finished bioengineered arteries to dialysis centers, replacing synthetics with living structures.

Analytical breakdowns for Humacyte, Inc.
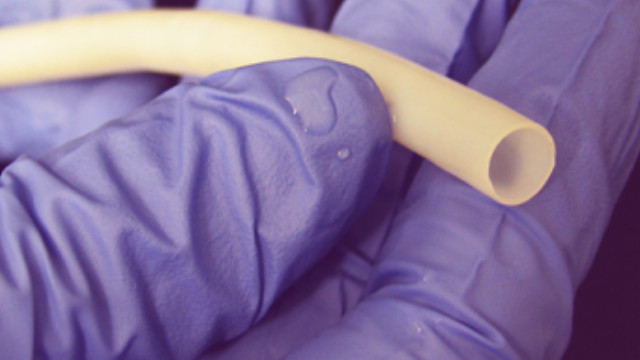
The integration of HAV bioengineered implants into the hospital practice of Humacyte, Inc. (HUMA) creates high switching costs, which is reflected in the current P/E valuation level. This ratio compares the market price of the share with net profit, determining the investment payback period. The calculation is based on the price-to-earnings per share ratio, measuring the premium paid for future growth. This allows for an assessment of capital stability relative to the issuer's fundamental earnings.
