HUMA Humacyte, Inc. Earnings per share growth rate in current year

The annual growth rate of net income per share for Humacyte, Inc. (HUMA) reflects the impact of FDA approval expectations and current sales under special programs. The foundation for growth is based on the pricing power of bioengineered vessels and the creation of a unique living tissue ecosystem for surgery. Meanwhile, the -59.70 mark indicates the current trend of this metric, capturing the company's earnings volatility in the present period.

Analytical breakdowns and data insights for company Humacyte, Inc. (HUMA)
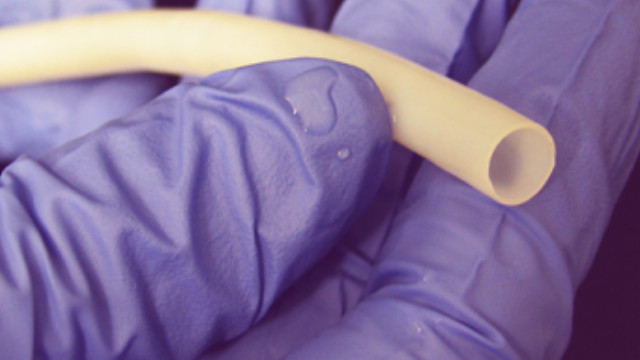
The dynamics of this metric reflect operational efficiency through the percentage change in net income per share compared to the same period last year. By analyzing the chart of annual EPS growth, an investor assesses the monetization of Humacyte, Inc. (HUMA) bioengineered tissues in cardiology and traumatology, where success in a narrow high-tech niche directly determines the pace of profit scaling and the fundamental value of the business.
