Hyster-Yale Corp (HY) Forward Price-to-Revenue Multiple

Corporate emblem and logo of Hyster-Yale Materials Handling, Inc. (HY)

The forward P/S based on forecasts illustrates the valuation dynamics of Hyster-Yale, Inc. (HY), where the metric remains around 0.10. Hyster-Yale, Inc. (HY) is developing eco-friendly lithium and hydrogen solutions to reduce environmental impact. A strategic alliance with warehouse automation plants optimizes client operations. The manufacturer's impeccable reputation ensures high trust within the B2B sector, rendering the shares a stable instrument for investors.

Hyster-Yale Materials Handling - HY Market Cap to Future Revenue Ratio (period 07/04/2022 - 11/17/2026)

Analytical breakdowns and data insights for company Hyster-Yale (HY)
- market price and analyst price targets:
Initial company analysis:Hyster-Yale Materials Handling HY
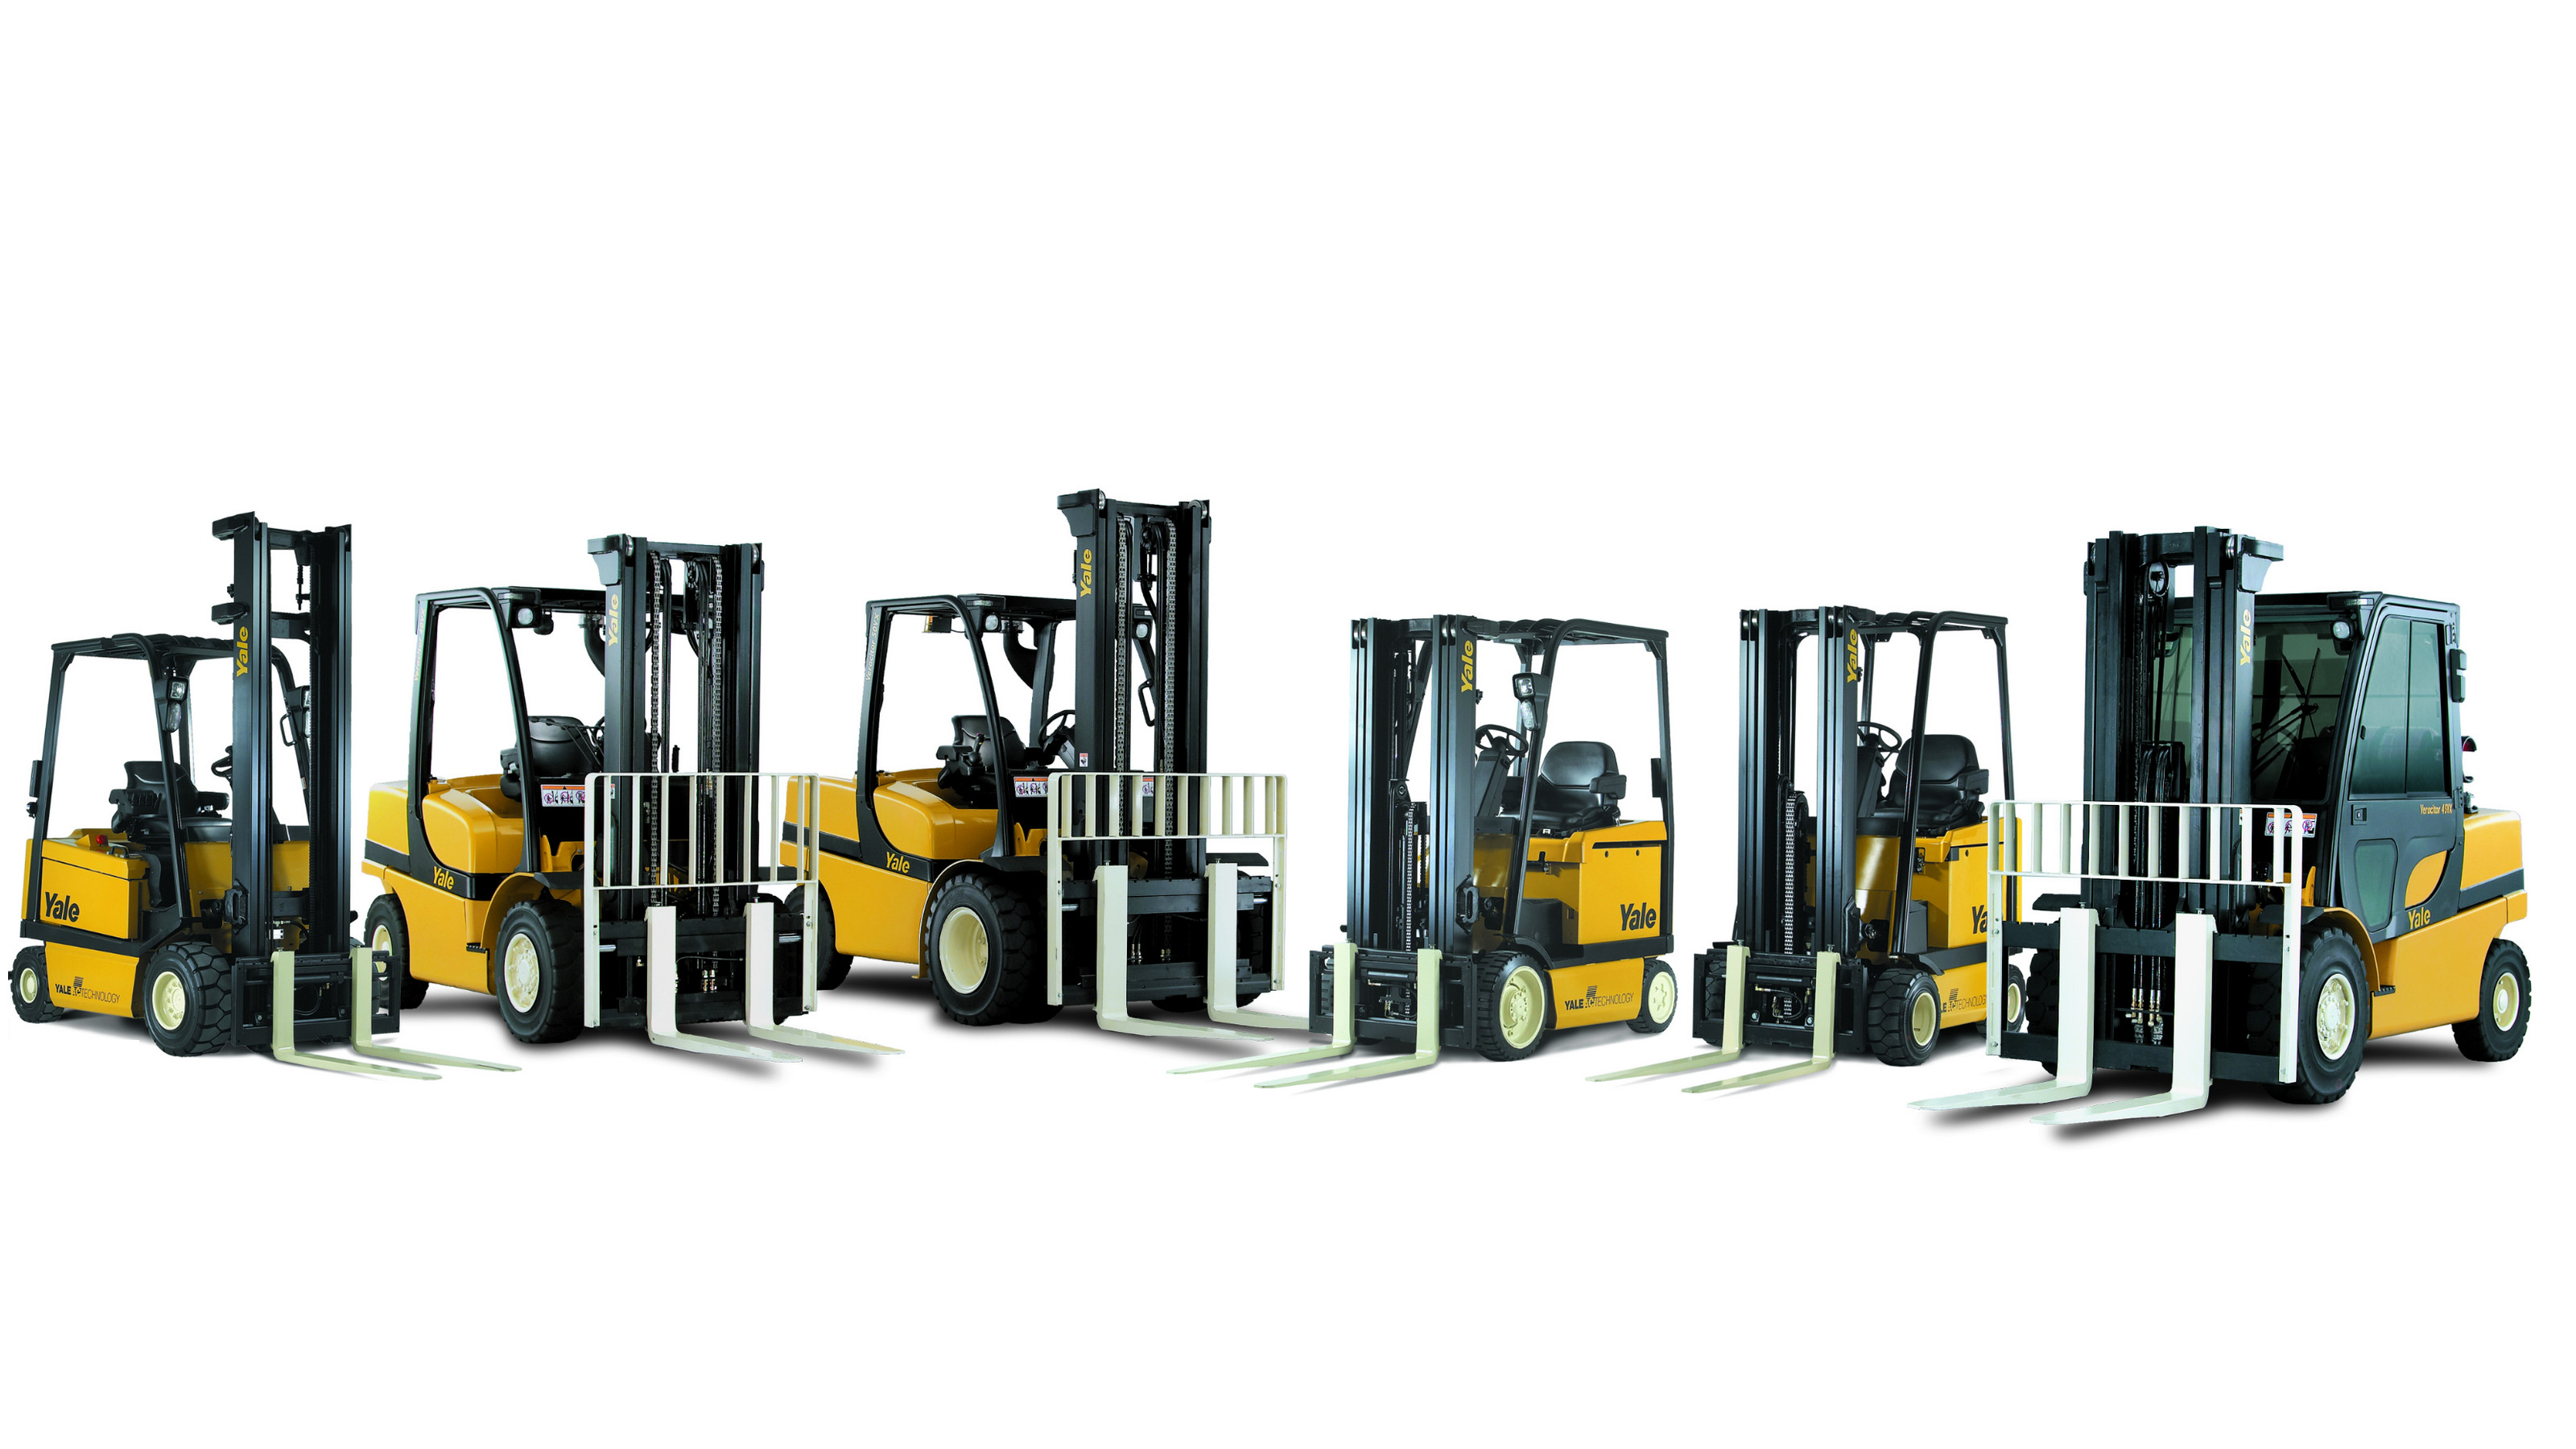
Manufactured products of hyster-yale.com

Investors value Hyster-Yale, Inc. (HY) for its business resilience, driven by a broad spectrum of warehouse equipment customers. The forward P/S is calculated as the ratio of current market capitalization to expected annual sales, measuring the market value of one dollar of future revenue. Analyzing the forward P/S metric allows investors to filter out market noise and identify the true trend of asset revaluation. The stable dynamics of this indicator confirm the fundamental attractiveness of the company's diversified model.

Competitors of Hyster-Yale, Inc.

Price-to-Projected Revenue Ratio up.com UNP|Forward Price to Sales PLD|Canadian Pacific Railway - Forward P/S Multiple|Forward Price to Sales NSC (Norfolk Southern)|CSX (CSX Corp.) - Forward Price-to-Revenue Multiple|Canadian National (CNI) - Forward P/S Multiple|PCAR (Kenworth) - Forward P/S Multiple|Public Storage REIT (PSA) - Market Cap to Expected Sales Ratio|Forward Price-to-Revenue Multiple CHRW (C.H. Robinson Corp)|XPO Logistics - Market Cap to Projected Revenue|Price-to-Projected Revenue Ratio U-Haul UHAL|Market Cap to Expected Sales Ratio Saia LTL Freight (SAIA)|TFII: Forward Price-to-Revenue Multiple|Ryder System Inc - Price to Expected Revenue Ratio|KNX (knight-swift.com) - Forward Price-to-Revenue Multiple|General American Transportation Corporation - Forward Price to Sales|Forward Price-to-Revenue Multiple LSTR|SNDR: Forward Price to Sales|Price-to-Projected Revenue Ratio RXO, Inc. (RXO)|Trinity Industries, Inc. - Market Cap to Projected Revenue|Forward P/S Multiple WERN (werner.com)|Distribution Solutions Group Inc (DSGR) - Market Cap to Future Revenue Ratio|ScanSource Inc - Forward P/S Multiple|HTLD (Heartland Express Inc) - Market Cap to Projected Revenue|ULH: Forward P/S Multiple|CVLG - Market Cap to Expected Sales Ratio|Price-to-Projected Revenue Ratio Wabash National|owens-minor.com (OMI) - Market Cap to Expected Sales Ratio|Forward P/S Multiple RLGT|PAMT - Market Cap to Future Revenue Ratio|Price-to-Projected Revenue Ratio Proficient Auto PAL|Market Cap to Expected Sales Ratio FreightCar America, Inc (RAIL)|YGMZ - Price-to-Projected Revenue Ratio|Market Cap to Expected Sales Ratio Eastern International ELOG|HXHX (Haoxin Holdings Ltd) - Forward Price-to-Revenue Multiple|Addentax - Forward Price to Sales|Forward Price-to-Revenue Multiple CTNT|Forward Price-to-Revenue Multiple EZFill (EZFL)|Price-to-Projected Revenue Ratio Nikola Motor Company (NKLA)|PTSI - Market Cap to Future Revenue Ratio|Daseke, Inc. - Forward Price-to-Revenue Multiple