Hyster-Yale, Inc. (HY): Price-to-Revenue Coefficient

Corporate company logo of Hyster Yale (HY)

The integration of equipment with Yale Vision software creates deep customer lock-in within the ecosystem. Hyster-Yale, Inc. (HY) rolling P/S ratio clearly links share prices to revenue, while the 0.10 metric indicates the status of the current valuation. Leadership in automation and electrical engineering drives growth, and a steady influx of capital from large orders ensures high capacity utilization.

HY - Hyster-Yale Corp P/S Multiple over the range 07/04/2022 - 11/16/2026

Hyster-Yale Corp (HY) - metric breakdowns and financial figures
- current quotes and average value forecast:
Summary company analytics:HY - Hyster-Yale
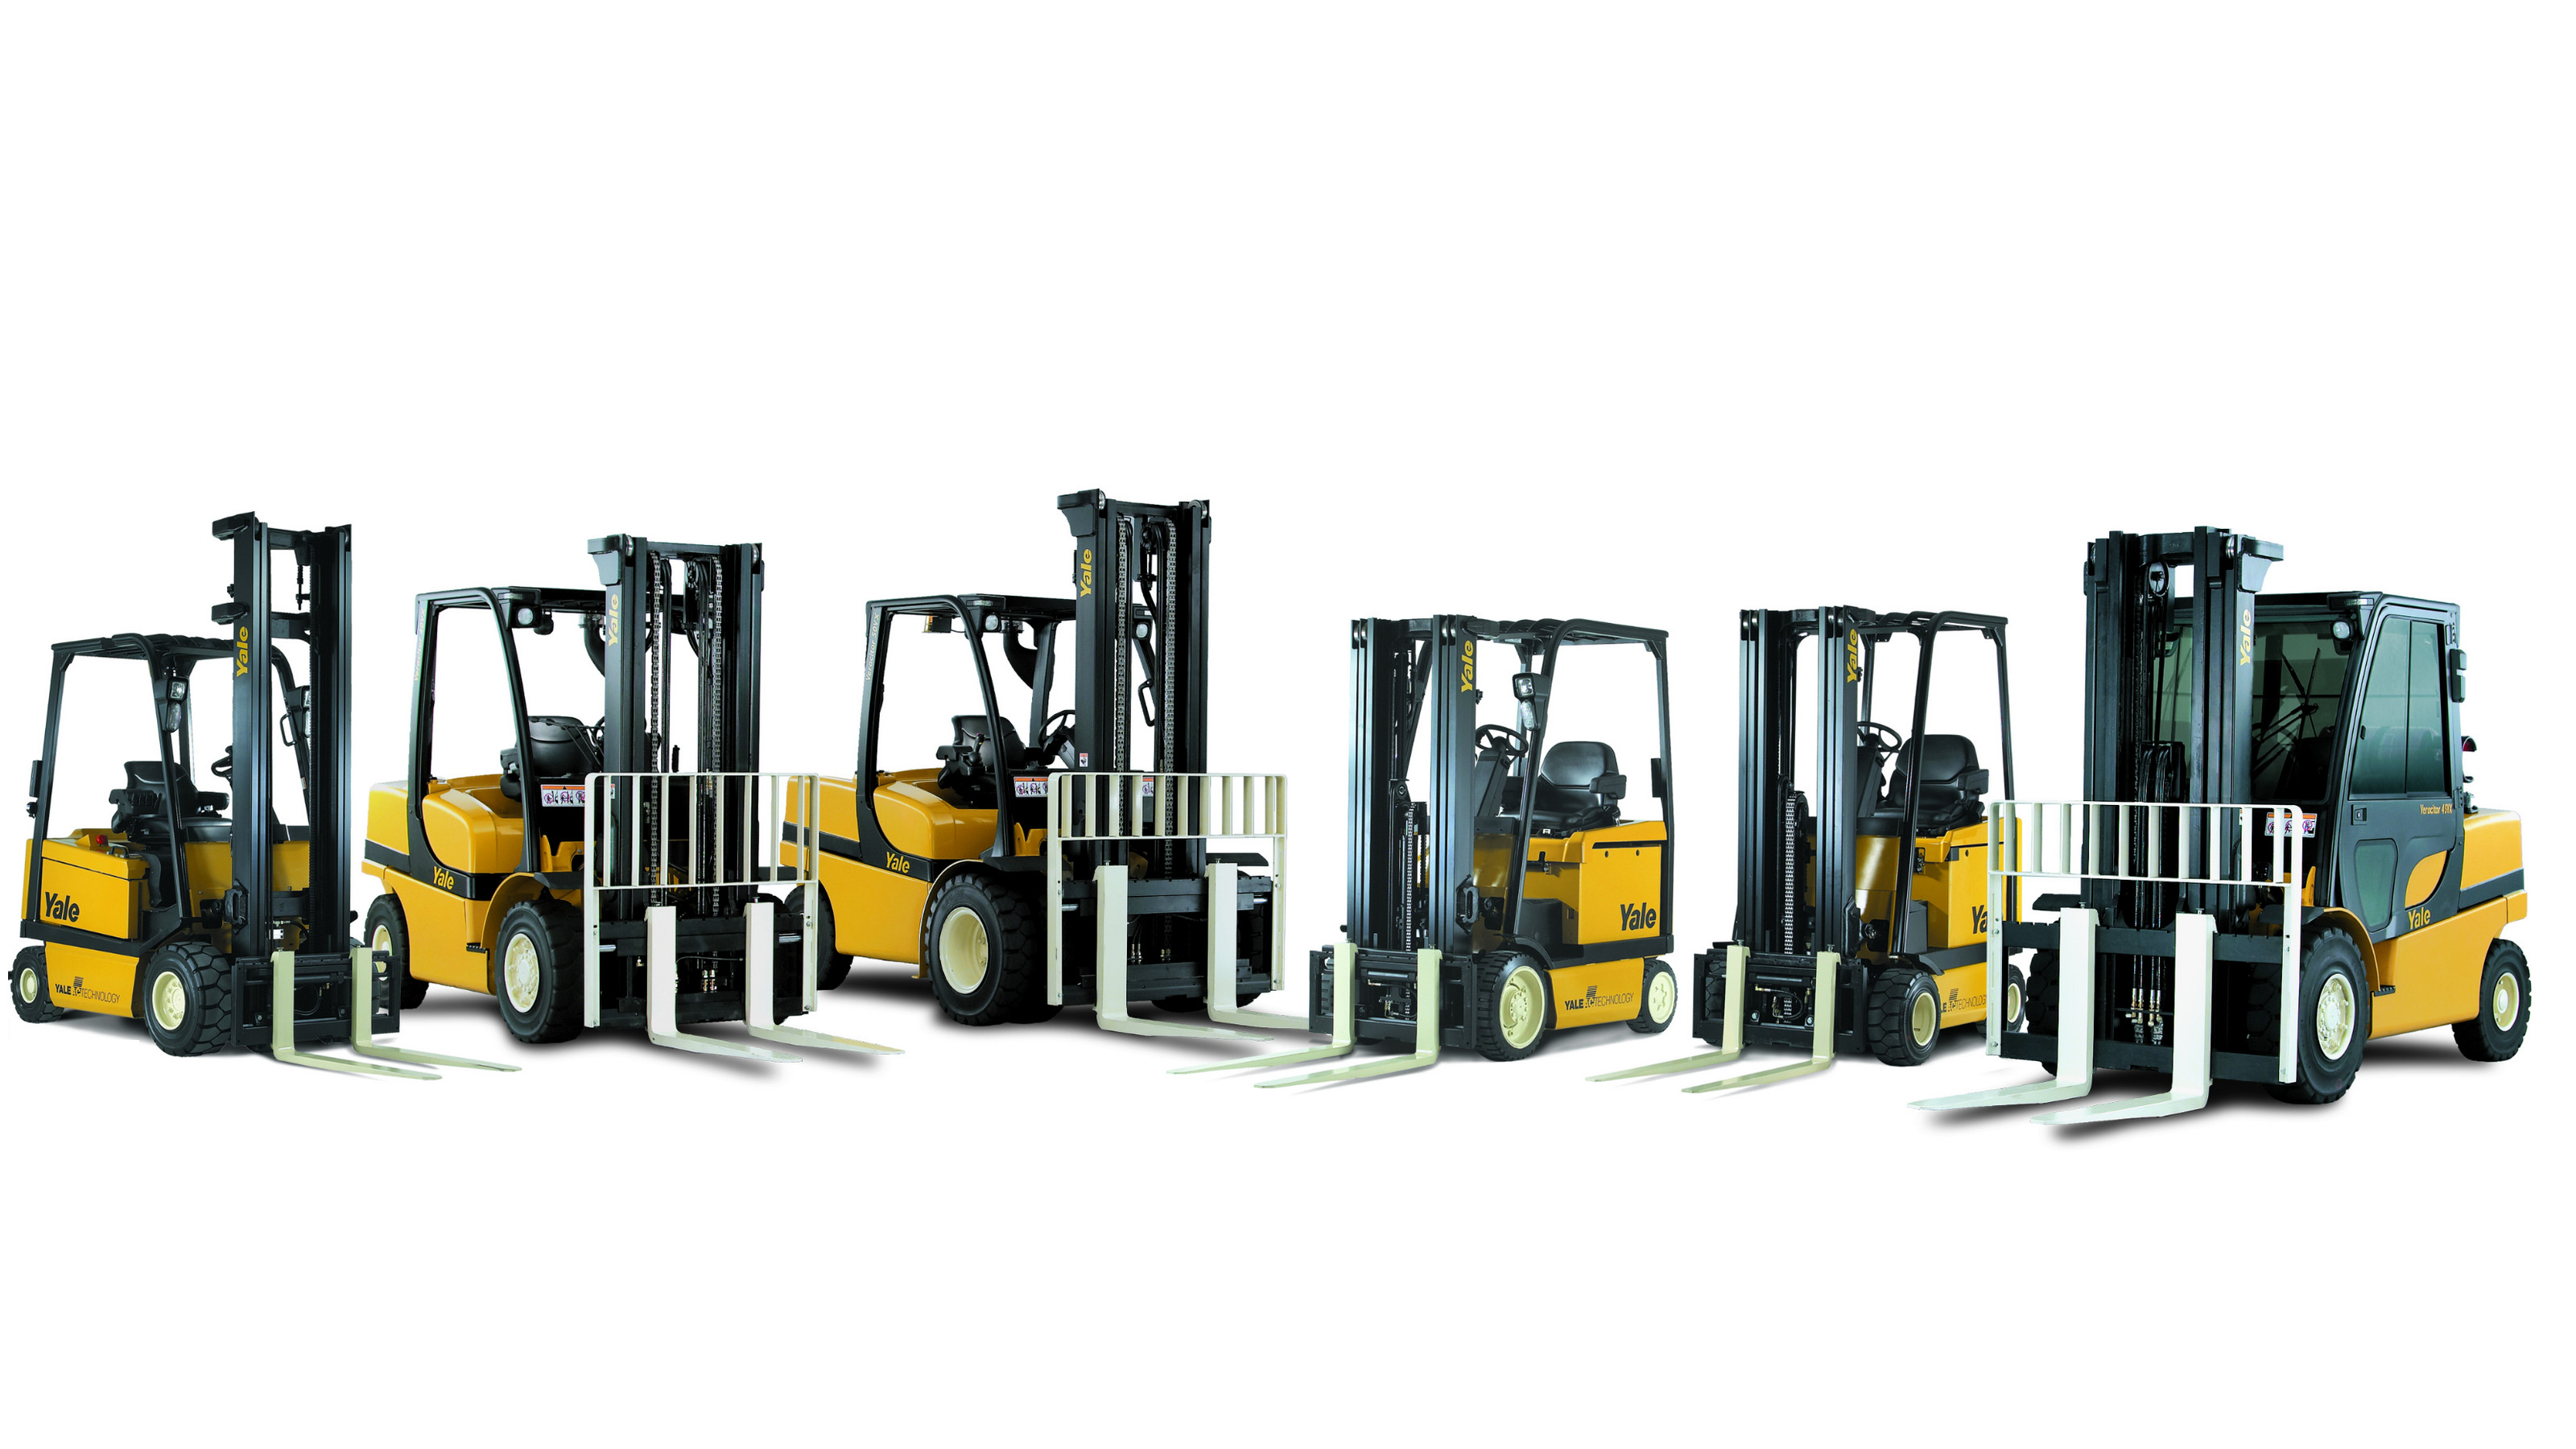
Finished products of Hyster-Yale Materials Handling, Inc.

Hyster-Yale, Inc. (HY) maintains stability through global B2B confidence in the reliability of its warehouse equipment and an extensive service network. The ratio of market capitalization to annual revenue, illustrated via the P/S ratio chart, allows for an assessment of the business value relative to its operating income, eliminating overpayment for market noise when comparing current values with the asset's long-term historical trends.

Competing companies

P/S Multiple Union Pacific Corporation (UNP)|Price-to-Revenue Ratio Prologis Corp PLD|CP: Market Cap to Revenue Ratio|NSC - Price-to-Revenue Ratio|CSX (CSX Corp) - Market Cap to Revenue Ratio|CNI: P/S Multiple|Market Cap to Revenue PACCAR|PSA (Public Storage Corp) - P/S Multiple|C.H. Robinson Worldwide (CHRW) - Price-to-Revenue Coefficient|Price-to-Revenue Ratio XPO Corp (XPO)|P/S Multiple amerco.com (UHAL)|P/S Multiple SAIA (Saia LTL Freight)|TFII: Market Cap to Revenue Ratio|R: Market Cap to Revenue|Price-to-Revenue Coefficient Knight-Swift Transportation KNX|General American Transportation Corporation (GATX) - Price-to-Revenue Ratio|Landstar - Market Capitalization-to-Revenue Ratio|Price-to-Revenue Ratio Schneider National|Market Cap to Revenue Ratio RXO (rxo.com)|P/S Multiple TRN|Market Cap to Sales Volume WERN|Price-to-Revenue Ratio distributionsolutionsgroup.com DSGR|Market Capitalization-to-Revenue Ratio SCSC|HTLD: Market Cap to Revenue|Price-to-Revenue Multiple Universal Logistics Holdings (ULH)|CVLG: P/S Multiple|Wabash Corp (WNC) - P/S Multiple|OMI (owens-minor.com) - P/S Multiple|RLGT (Radiant Logistics, Inc.) - Market Cap to Sales Volume|Price-to-Revenue Ratio PAM Transport (PAMT)|PAL (Proficient Auto Logistics Inc) - Market Capitalization-to-Revenue Ratio|P/S Multiple RAIL (FreightCar)|YGMZ - Market Cap to Revenue|Eastern International Ltd. - P/S Multiple|HXHX: Price-to-Revenue Ratio|Addentax (ATXG) - Price-to-Revenue Ratio|Price to Sales Cheetah Net Supply Chain (CTNT)|EZFL (getyourezfill.com) - P/S Multiple|Market Cap to Revenue Ratio NKLA (Nikola Motor Company)|Price-to-Revenue Ratio P.A.M. Transportation Services, Inc. (PTSI)|Price-to-Revenue Coefficient Daseke