TFII: TFI International Inc Forward P/S Multiple

Corporate emblem and logo of TFI International Inc. (TFII)

TFI International Inc. (TFII) management's competence in restructuring loss-making carriers is driving margin growth, as confirmed by the forward P/S trajectory. The value of 0.60 indicates the level of this metric. However, expansion through the acquisition of US assets requires massive expenditures on fleet and personnel, which significantly limits business scalability by tying revenue to capital expenditures.

TFI International Inc - TFII Market Cap to Expected Sales Ratio (period 07/04/2022 - 11/14/2026)

Analytical breakdowns for TFI International Inc.
- stock price and consensus target price:
Fundamental company valuation:TFI International (TFII)
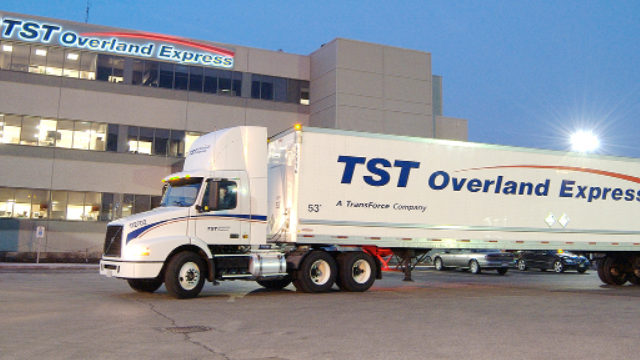
Product sample of TFI International Inc.

To select assets with high fundamental stability, it is critical to evaluate the forward revenue multiple, which compares the business's market value to expected sales volume. By analyzing the expected P/S chart for TFI International Inc. (TFII), an investor determines the ability of TFI International Inc. (TFII) to curb cost inflation and maintain margins amid cyclical freight shipping, utilizing aggressive expansion and cost optimization to mitigate market risks.

Competing companies

Union Pacific Railroad - Forward Price-to-Revenue Multiple|Price to Expected Revenue Ratio PLD (Prologis Inc)|CP Rail - Forward P/S Multiple|Future Price to Revenue NSC|CSX: Forward P/S Multiple|CNI - Market Cap to Expected Sales Ratio|Forward Price-to-Revenue Multiple PCAR|PSA: Forward Price to Sales|Forward P/S Multiple CHRW|Market Cap to Expected Sales Ratio xpo.com|Price-to-Projected Revenue Ratio U-Haul Holding Company UHAL|SAIA: Market Cap to Projected Revenue|R: Forward Price-to-Revenue Multiple|Knight-Swift Transportation Holdings Inc. - Price to Expected Revenue Ratio|GATX: Forward P/S Multiple|Market Cap to Future Revenue Ratio Landstar Express America (LSTR)|Price-to-Projected Revenue Ratio Schneider Corp|RXO: Forward Price to Sales|Price-to-Projected Revenue Ratio Trinity Industries (TRN)|Werner - Market Cap to Projected Revenue|Forward P/S Multiple DSGR (Distribution Solutions Group, Inc.)|Forward P/S Multiple ScanSource Direct SCSC|HTLD: Forward Price-to-Revenue Multiple|Hyster Yale - Price to Expected Revenue Ratio|ULH: Forward P/S Multiple|CVLG - Market Cap to Expected Sales Ratio|Price-to-Projected Revenue Ratio Wabash National Corp|Market Cap to Future Revenue Ratio Owens & Minor Healthcare OMI|Price-to-Projected Revenue Ratio Radiant Logistics, Inc. (RLGT)|PAM Transportation - Market Cap to Projected Revenue|Forward P/S Multiple PAL (Proficient Auto Logistics, Inc.)|Forward P/S Multiple FreightCar America Inc. RAIL|YGMZ - Price-to-Projected Revenue Ratio|ELOG: Price-to-Projected Revenue Ratio|HXHX (Haoxin Holdings Ltd) - Forward Price-to-Revenue Multiple|Addentax Group - Forward Price to Sales|CTNT (Cheetah Net Supply Chain Corp) - Forward P/S Multiple|EZFill Holdings, Inc. (EZFL) - Market Cap to Expected Sales Ratio|Price-to-Projected Revenue Ratio Nikola Corp (NKLA)|PAM Transportation Services - Market Cap to Projected Revenue|Forward P/S Multiple DSKE (Daseke, Inc.)