IBP: installedbuildingproducts.com Cash Calculated per Single Share

Installed Building Products (IBP) capitalizes on the momentum of its relationships with developers, which ensure a steady stream of orders. In the short term, the trust of the largest US developers guarantees timely delivery. The liquid assets per share metric visualizes this balance, with the value holding around 15.70. Current growth is driven by pricing power and demand in the commercial sector, creating a tangible effect.

Comprehensive metric breakdowns and analytics for Installed Building Products, Inc. (IBP)
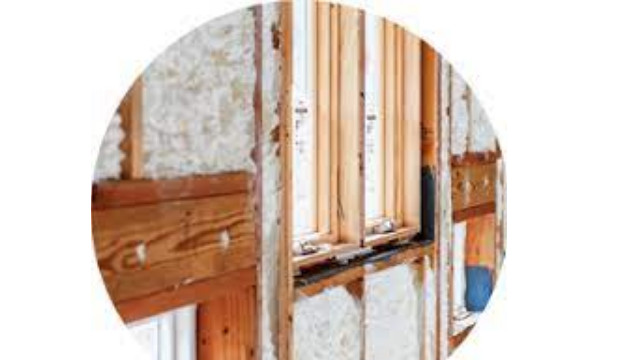
The market values Installed Building Products (IBP) as a stable profit stream driven by inertial demand from developers, where margin predictability requires a precise liquidity balance. By analyzing the dynamics of highly liquid assets per share, an investor can see the volume of net cash available per security, which determines the level of risk protection without compromising the return on equity.
