INHD Inno Holdings Year-over-year earnings per share growth for the last twelve months

Price containment for modules due to declining demand in the US is impacting the quarterly EPS growth rate, where the 99.80 level serves as a critical benchmark. While the efficient delivery of steel panels accelerates construction, mortgage rates and metal costs create financial risks for Inno Holdings Inc. (INHD), directly affecting the earnings per share dynamics.

innometalstuds.com - analytical breakdowns and key metrics (INHD)
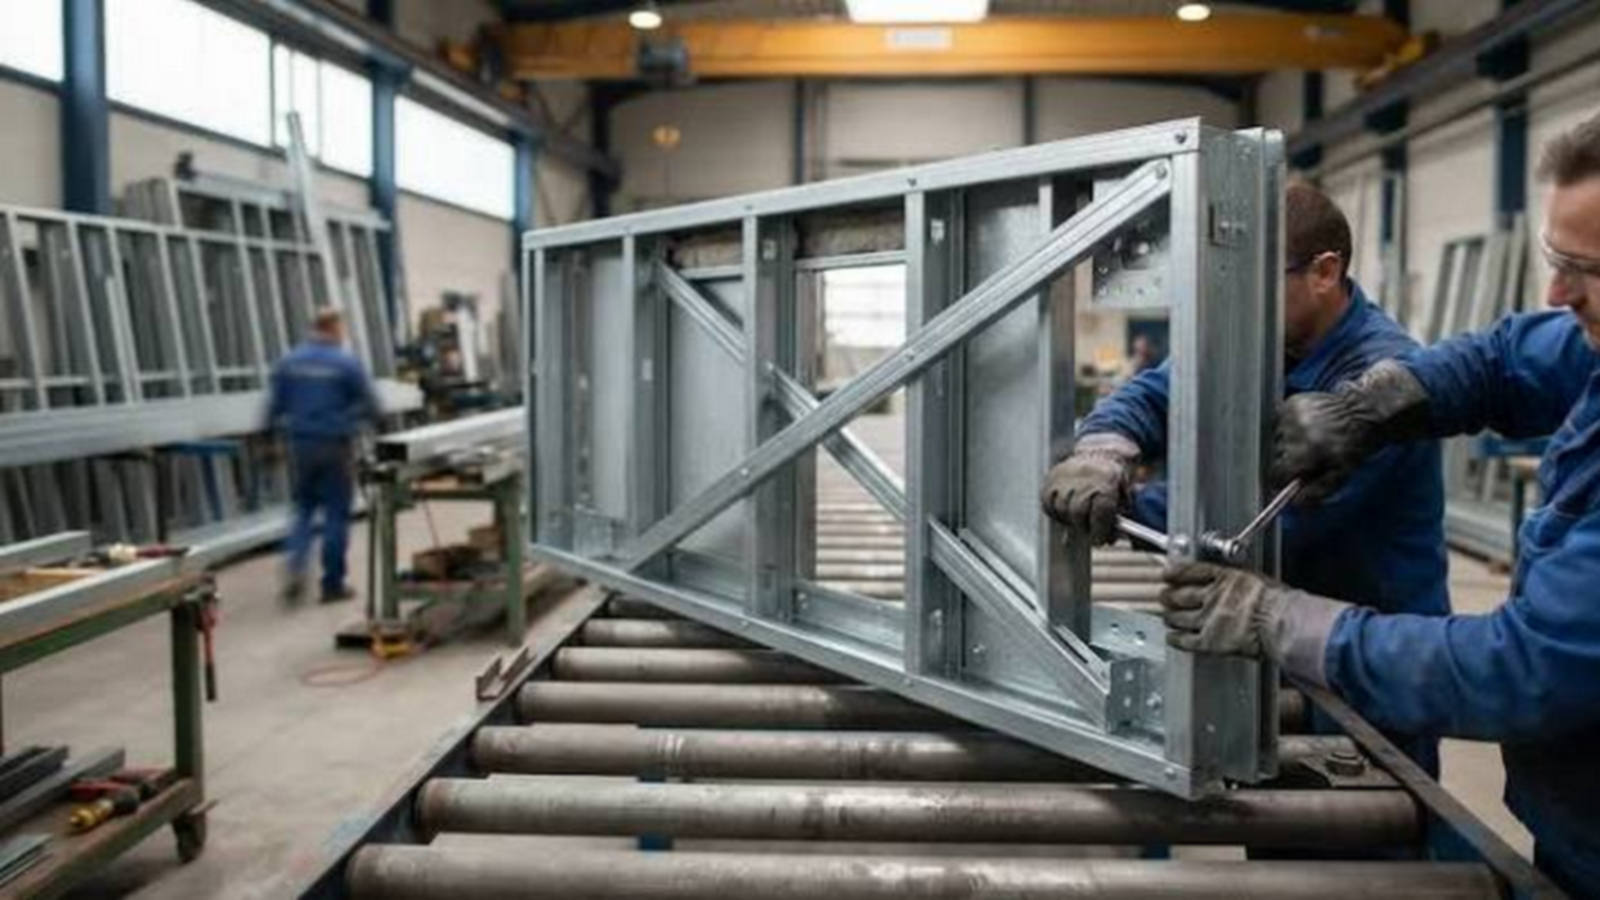
The investment attractiveness of Inno Holdings Inc. (INHD) is based on stable demand within the US domestic real estate market, which eliminates geopolitical risks for the production of steel frames. The quarterly EPS growth trend measures the rate of change in net profit per share, allowing for an assessment of capital protection against inflation; by analyzing the current quarterly EPS growth value, an investor determines the company's fundamental resilience to cyclical downturns.
