Inno Holdings Corp (INHD): Price-to-Revenue Coefficient

Inno Holdings Inc. (INHD) aims to dominate the prefabricated housing niche by leveraging patents for mobile machinery. The GURU.Markets interface displays the price-to-sales per share ratio as a stage in achieving this goal, where the 1.20 level represents the current value. Premium pricing for steel profiles serves as an advantage, although mortgage trends and occupancy risks remain constraining factors.

Analytical breakdowns for innometalstuds.com (INHD)
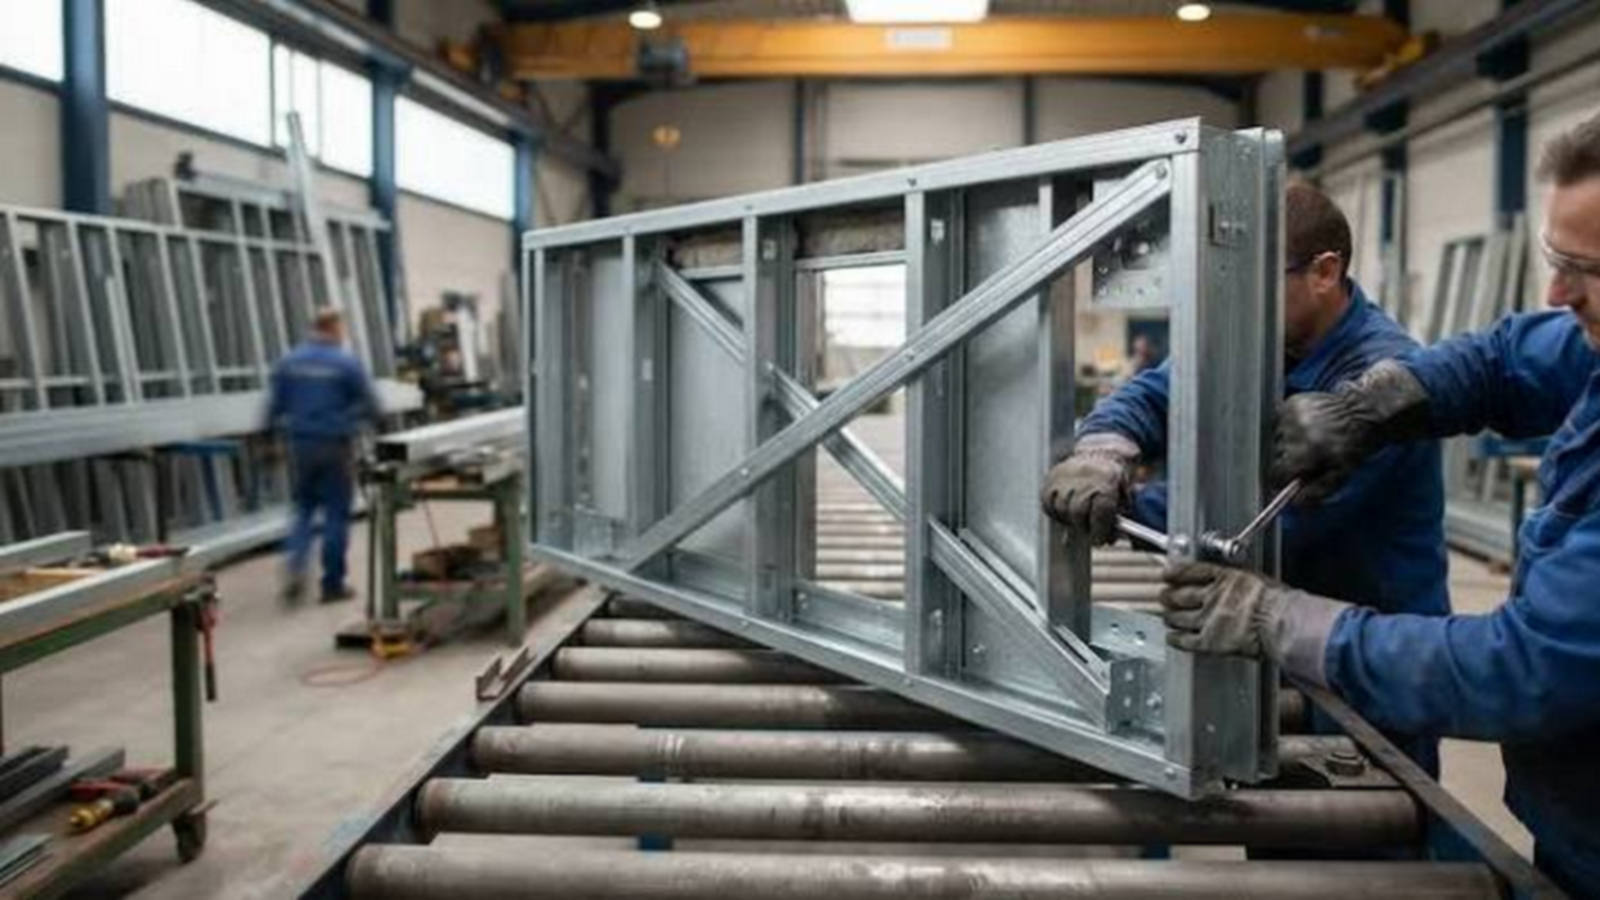
Fundamental asset screening requires an accurate valuation of a business relative to its operating income. The P/S ratio correlates market capitalization with annual revenue, eliminating the impact of debt load on the final valuation. By analyzing P/S multiple fluctuations, an investor determines the degree of asset overheating across different market phases. For Inno Holdings Inc. (INHD), this metric reflects the market value of implementing energy-efficient ESG standards into the production of steel modular structures.
