INHD: innometalstuds.com Price to Net Income Growth Ratio

Inno Holdings Inc. (INHD) faces industry conservatism and stringent regulation. Limited plant geography and low regional demand increase the costs of beam production. The efficiency of modular frames is constrained by metal prices. The weighted P/E relative to earnings growth rates helps identify the asset's undervaluation, with the indicator currently standing at 0.00.

Metric breakdowns and analytics for Inno Metal Studs (INHD)
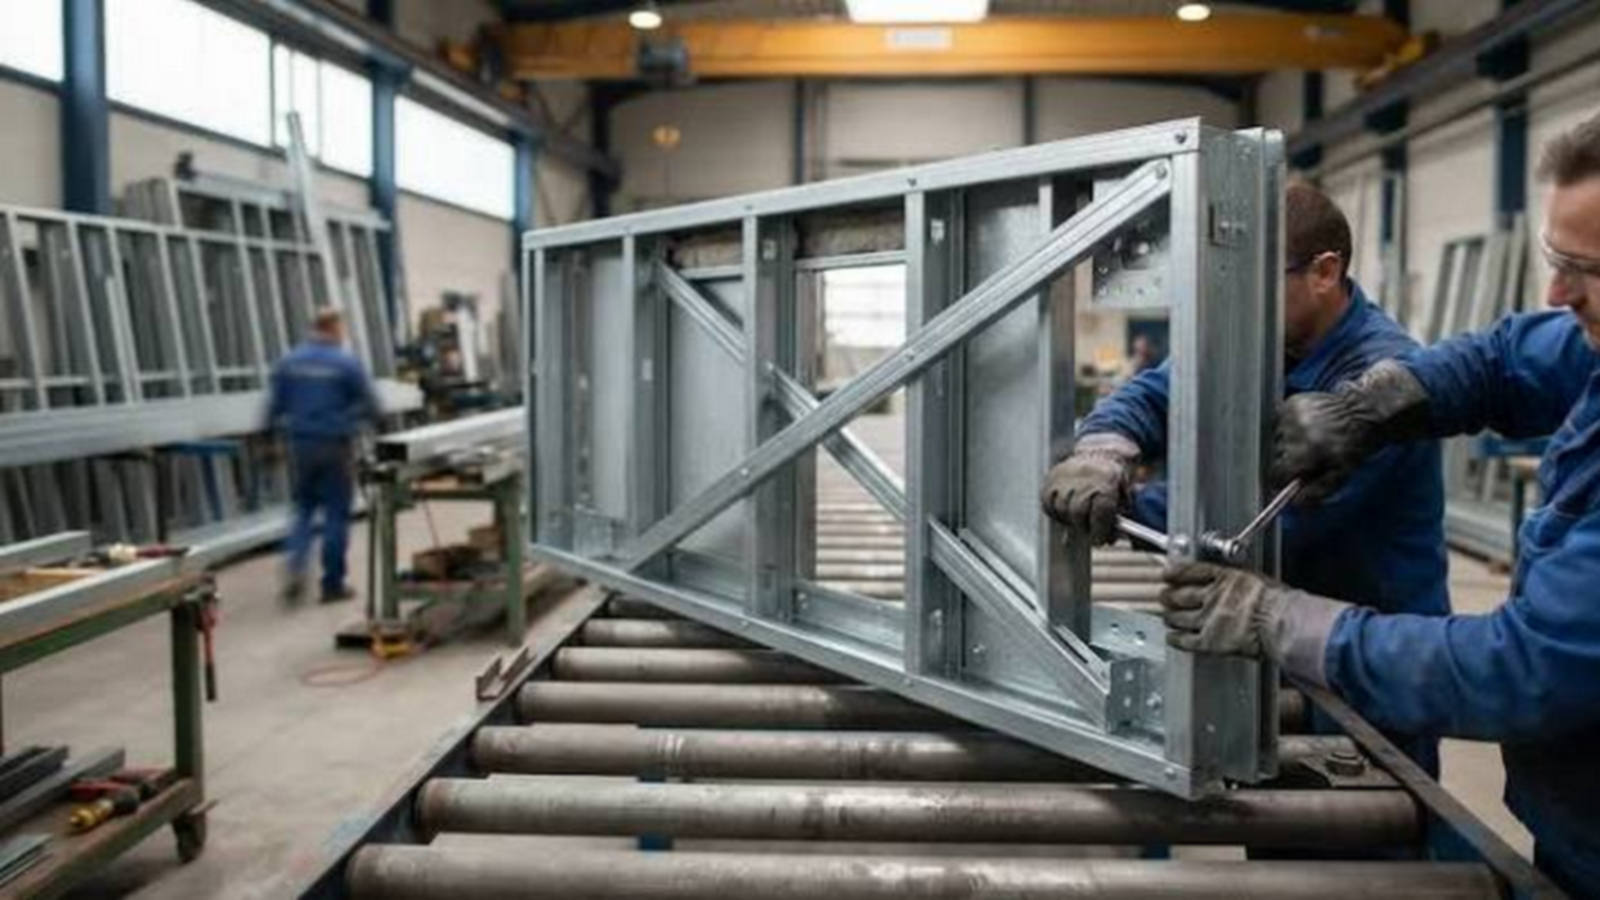
Production automation of steel profiles at Inno Holdings Inc. (INHD) optimizes costs, ensuring a steady cash flow. The PEG ratio correlates the P/E multiple with earnings growth rates to determine the cost of each unit of growth. By analyzing PEG ratio dynamics, an investor identifies fundamental undervaluation when values fall below one. This chart reflects the balance between business expansion and market expectations. Consensus indicates potential for share price growth.
