LENSAR Inc. (LNSR): Market Cap to Revenue

Symbol and logo of brand LENSAR Inc. (LNSR)

Sales are constrained by tight clinic budgets and high marketing expenses, while internal growth is driven by AI visualization developments within the ALLY system. The established high-precision ophthalmology ecosystem integrates these factors, and the current P/S valuation demonstrates the business resilience of LENSAR, Inc. (LNSR), where the parameter value reaches 1.00, helping investors avoid speculative risks when analyzing capitalization.

LNSR LENSAR Inc. P/S Multiple (07/04/2022 - 11/13/2026)

Analytical breakdowns for LENSAR, Inc (LNSR)
- share price and consensus valuation forecast:
- stock exchange capitalization data:
General company analysis:LNSR lensar.com
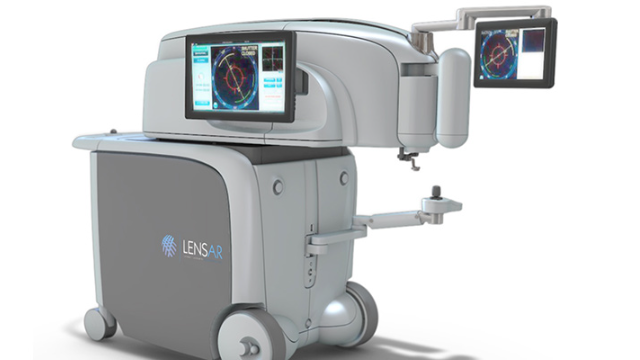
Core merchandise of LENSAR, Inc.

The integration of 3D visualization within the ALLY platform creates high added value, which the market evaluates through the ratio of market capitalization to total revenue. By analyzing the P/S multiple, an investor determines how many dollars of market value are attributed to each unit of sales, allowing for an assessment of the monetization efficiency of the technological advantage of LENSAR, Inc. (LNSR) and the sustainability of the current business valuation relative to its revenue base.

Competitors of LENSAR, Inc.

DXCM (dexcom.com) - Market Capitalization-to-Revenue Ratio|Price-to-Revenue Ratio Penumbra PEN|NOVT - Market Cap to Revenue|Haemonetics Corp. - P/S Multiple|Price to Sales Inspire Medical Systems Inc|PRCT: P/S Multiple|Market Cap to Revenue Ratio CNMD|PLSE (Pulse Biosciences) - P/S Multiple|InMode Ltd (INMD) - Price-to-Revenue Coefficient|P/S Multiple PMI|Market Cap to Revenue Surmodics Inc. SRDX|P/S Multiple SENS (Senseonics Holdings)|P/S Multiple neuropace.com NPCE|TCMD - Price-to-Revenue Ratio|SNWV: Price-to-Revenue Ratio|OM (Outset) - Market Cap to Revenue|Electromed - Market Capitalization-to-Revenue Ratio|RCEL (AVITA Medical, Inc.) - P/S Multiple|Price to Sales Profound Medical Corporation PROF|Price-to-Revenue Ratio Baird Medical Investment (BDMD)|edap-tms.com (EDAP) - Price-to-Revenue Multiple|Apyx Medical Corporation - Market Cap to Revenue|P/S Multiple IceCure Medical Ltd. ICCM|Pulmonx Corp. - P/S Multiple|Price-to-Revenue Coefficient TELA Bio, Inc. TELA|cytosorbents.com (CTSO) - Price-to-Revenue Ratio|Price-to-Sales Ratio SRTS (Sensus Healthcare Inc)|Price-to-Revenue Ratio Zynex Inc|Market Cap to Revenue electroCore Medical (ECOR)|P/S Multiple RBOT|IINN - Price to Sales|Price-to-Revenue Ratio SeaStar Medical ICU|IRIX: Market Cap to Revenue Ratio|INBS: Market Cap to Revenue|Beyond Air, Inc. - Market Cap to Sales Volume|Profusa Inc (PFSA) - Price-to-Revenue Ratio|SSKN (STRATA Skin Sciences, Inc.) - Price-to-Revenue Ratio|GCTK (GlucoTrack, Inc.) - P/S Multiple|Price to Sales nanovibronix.com NAOV|Price-to-Revenue Ratio Venus Concept Corp (VERO)|Nuwellis Corp - Market Cap to Revenue Ratio|Price-to-Revenue Ratio Aethlon Medical AEMD|Price-to-Revenue Coefficient Asensus Surgical Inc (ASXC)|Avinger - P/S Multiple|BSGM - P/S Multiple|Cutera, Inc (CUTR) - Price-to-Revenue Ratio|Know Labs Corporation - Market Capitalization-to-Revenue Ratio|Market Cap to Revenue NARI|NVRO: Market Capitalization-to-Revenue Ratio|P/S Multiple RSLS|Price-to-Revenue Coefficient Silk Road Medical, Inc.