LENSAR Inc (LNSR) - Market Cap to Earnings

Corporate emblem and logo of LENSAR Inc. (LNSR)

The LENSAR, Inc. (LNSR) chart on the GURU.Markets platform shows a PE ratio of 4.20. This price action is supported by the production of femtosecond systems and software designed to enhance surgical visibility. LENSAR, Inc. (LNSR) leads the ophthalmology sector through its ALLY laser and the implementation of AI-driven visualization. Meanwhile, demand for such services depends on client wealth, meaning the business grows in tandem with the broader economic recovery.

LENSAR Inc (LNSR): Price to Earnings Ratio from 07/04/2022 to 11/14/2026
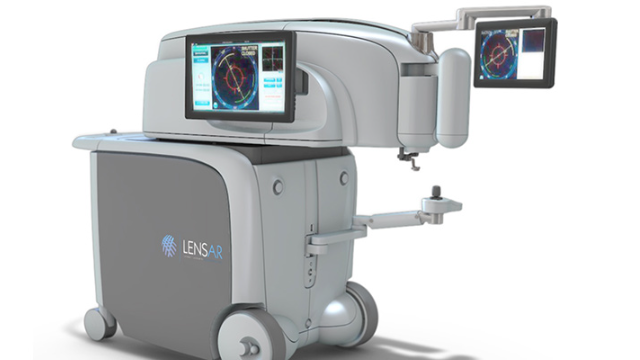
Manufactured product of LENSAR, Inc.

The P/E ratio reflects the market value of one unit of annual profit, determining the investment payback period. The indicator is calculated as the ratio of the current share price to the net profit per share. Analyzing this price-to-earnings valuation reveals whether an asset is overbought or undervalued. For LENSAR, Inc. (LNSR), this parameter is critical, as pressure from medtech behemoths limits scaling even in the presence of high-quality management.

Analysis of competing companies

Dexcom - Market Cap to Net Income|Price to Earnings Ratio PEN (Penumbra Inc)|NOVT - Market Cap to Earnings|Haemonetics Corp. - Price to Earnings Ratio|P/E Multiple Inspire Medical Systems, Inc. INSP|PRCT: Price to Earnings Ratio|CONMED - Market Price to Net Income Ratio|PLSE: P/E Multiple|INMD - Business Payback Period|Price to Earnings Ratio PMI|Price to Earnings Ratio Surmodics (SRDX)|Price to Earnings Ratio SENS (Senseonics Holdings, Inc.)|NPCE (NeuroPace Inc) - Company Value to Net Income|Price to Earnings Ratio Tactile Systems Technology TCMD|SNWV - Price to Earnings Ratio|outsetmedical.com - P/E Multiple|Market Cap to Earnings smartvest.com|RCEL: P/E Multiple|Price to Earnings Multiple PROF|BDMD (Baird Medical) - P/E Multiple|EDAP TMS S.A. (EDAP) - Business Payback Period|P/E Multiple APYX|Price to Earnings Ratio IceCure Medical ICCM|P/E Multiple LUNG (Pulmonx Corp)|P/E Multiple TELA Bio, Inc. TELA|CTSO - Price to Earnings Ratio|SRTS: Price to Earnings Ratio|ZYXI (Zynex, Inc.) - Price to Earnings Ratio|electroCore Inc - Company Value to Net Income|RBOT (Vicarious Surgical Inc) - P/E Multiple|Market Cap to Earnings inspira-technologies.com IINN|Price to Earnings Ratio ICU (SeaStar Medical Holding Corporation)|IRIDEX Corp. (IRIX) - Market Cap to Net Income Ratio|Intelligent Bio Solutions Inc - Price to Earnings Ratio|P/E Multiple AINostix XAIR|Profusa Inc. - P/E Multiple|Business Payback Period STRATA Skin Sciences, Inc. SSKN|GlucoTrack (GCTK) - Price to Earnings Ratio|Market Cap to Net Income NAOV (NanoVibronix Inc.)|Price to Earnings Ratio venusconcept.com|Price to Earnings Ratio Nuwellis, Inc. (NUWE)|P/E Multiple AEMD|ASXC - Market Cap to Earnings|Price to Earnings Ratio Avinger, Inc. AVGR|BSGM: Price to Earnings Multiple|CUTR: Price to Earnings Ratio|KNW - P/E Multiple|NARI: P/E Multiple|Price to Earnings Multiple NVRO|RSLS (ReShape Lifesciences, Inc.) - P/E Multiple|Silk Road Medical Inc (SILK) - Business Payback Period