Vicarious Surgical Inc (RBOT): Market Cap to Revenue

Symbol and logo of brand Vicarious Surgical Corp (RBOT)

Vicarious Surgical Inc. (RBOT) generates revenue through a combination of robot sales and high-margin consumables, while outsourcing component manufacturing to external EMS partners. The P/S ratio trend reflects the current market valuation of revenue, where the mark indicates the business value level. This growth is supported by the structural trend of medical automation, which makes the company resilient to GDP fluctuations.

RBOT Vicarious Surgical Corp P/S Multiple (07/04/2022 - 11/16/2026)

Analytical breakdowns for Vicarious Surgical Inc (RBOT)
- share price and consensus valuation forecast:
- stock exchange capitalization data:
General company analysis:RBOT Vicarious Surgical Inc.
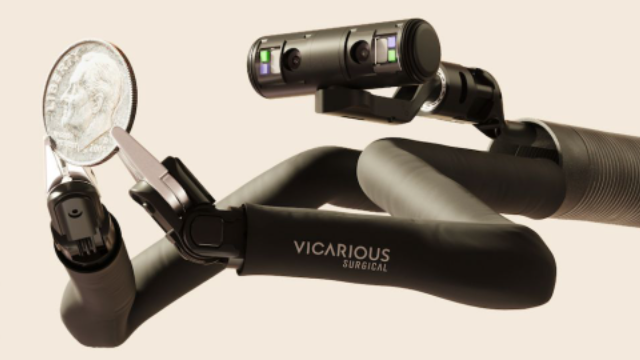
Core merchandise of Vicarious Surgical

The P/S ratio compares market capitalization to annual revenue, assessing how much investors are willing to pay per unit of current sales. For Vicarious Surgical Inc. (RBOT), this metric reflects expectations for scaling a "razor-and-blade" model through high-margin software and consumables. By analyzing the price-to-sales multiple, one can determine the extent of future growth already priced in. Low indicator values signal that the asset is undervalued, while extreme peaks increase the risk of a correction.

Competitors of Vicarious Surgical Inc.

DXCM (DexCom Inc) - Market Capitalization-to-Revenue Ratio|P/S Multiple PEN (penumbrainc.com)|NOVT - Market Cap to Revenue|Haemonetics - P/S Multiple|Price to Sales Inspire Medical Systems|PRCT: P/S Multiple|Market Cap to Revenue Ratio CNMD|PLSE (Pulse Medical) - P/S Multiple|InMode Corp (INMD) - Price-to-Revenue Coefficient|P/S Multiple PMI|Market Cap to Revenue Surmodics, Inc. SRDX|P/S Multiple SENS (senseonics.com)|P/S Multiple NeuroPace Inc NPCE|TCMD - Price-to-Revenue Ratio|SNWV: Price-to-Revenue Ratio|Outset Medical Corp (OM) - Price-to-Revenue Ratio|SmartVest - Market Capitalization-to-Revenue Ratio|LNSR (LENSAR Inc) - P/S Multiple|Price to Sales AVITA Medical Inc. RCEL|Price-to-Revenue Ratio Profound Medical (PROF)|Baird Medical Corp (BDMD) - Price-to-Revenue Multiple|EDAP TMS SA - Market Cap to Revenue|P/S Multiple Bovie Medical APYX|IceCure Medical Ltd. - P/S Multiple|Price-to-Revenue Coefficient Pulmonx LUNG|TELA Bio (TELA) - Price-to-Revenue Ratio|Price-to-Sales Ratio CTSO (CytoSorbents Corp.)|Price-to-Revenue Ratio sensushealthcare.com|Market Cap to Revenue Zynex, Inc. (ZYXI)|P/S Multiple ECOR|IINN - Price to Sales|SeaStar Medical - Market Cap to Revenue|IRIX: Market Cap to Revenue Ratio|INBS: Market Cap to Revenue|beyondair.net - Market Cap to Sales Volume|Profusa Inc (PFSA) - Price-to-Revenue Ratio|SSKN - Price-to-Revenue Coefficient|Price-to-Revenue Ratio GlucoTrack|P/S Multiple NanoVibronix Inc.|Price-to-Revenue Ratio Venus Concept (VERO)|Market Cap to Revenue Nuwellis, Inc. NUWE|P/S Multiple AEMD (Aethlon Medical, Inc.)|ASXC: Market Cap to Revenue Ratio|Avinger Inc. - P/S Multiple|Price-to-Revenue Coefficient BioSig Technologies, Inc BSGM|CUTR: P/S Multiple|Know Labs, Inc. (KNW) - P/S Multiple|Price-to-Revenue Ratio Inari Medical Inc|Market Cap to Revenue Nevro Corp (NVRO)|Market Cap to Revenue RSLS (ReShape Lifesciences, Inc.)|P/S Multiple Silk Road Medical Inc. (SILK)