23andMe Holding Co (ME) Return on Sales by Net Profit

The transition to a paid subscription model and AI-driven health analysis is yielding a moderate effect while therapeutic developments are still taking shape for 23andMe Holding Co. (ME). Geopolitical tensions are complicating patent protection and component logistics. The company's net margin profile confirms these risks, with the indicator standing at -187.00. However, diversification through the integration of genetic testing with drug discovery based on a massive array of DNA data creates a unique foundation for resilience.

Financial and market metric breakdowns for 23andMe Inc. (ME)
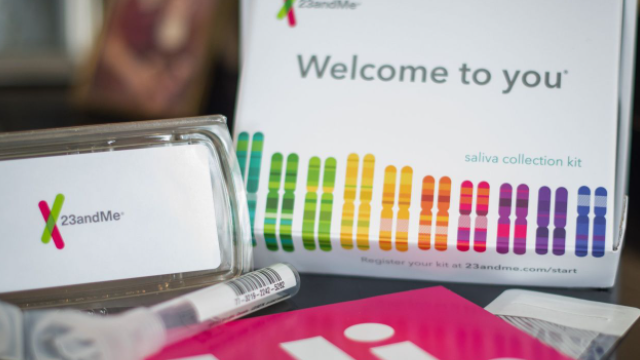
Amid cost restructuring and the privatization of 23andMe Holding Co. (ME), the net profit margin chart becomes a key tool for monitoring efficiency. This indicator determines the share of net income relative to total revenue. The calculation is based on a daily comparison of the bottom line against total income. Positive momentum confirms the success of Anne Wojcicki's strategy; however, investors should consider the debt load, which could offset operational growth.
