PRE: Prenetics Market Cap to Earnings

Prenetics Global Limited - graphic logo of issuer PRE

The genetic screening and rapid diagnostics sector demonstrates high resilience to macroeconomic shocks due to stable demand. Expanding the presence in Asia through affordable oncology tests is driving growth in the customer base. This daily price action for Prenetics Global (PRE) with the -3.90 indicator confirms the business dynamics. Service efficiency is ensured by a streamlined system for the rapid transport of biomaterials to research centers.

Prenetics (PRE) P/E Multiple: for the period 04/28/2023 - 11/11/2026
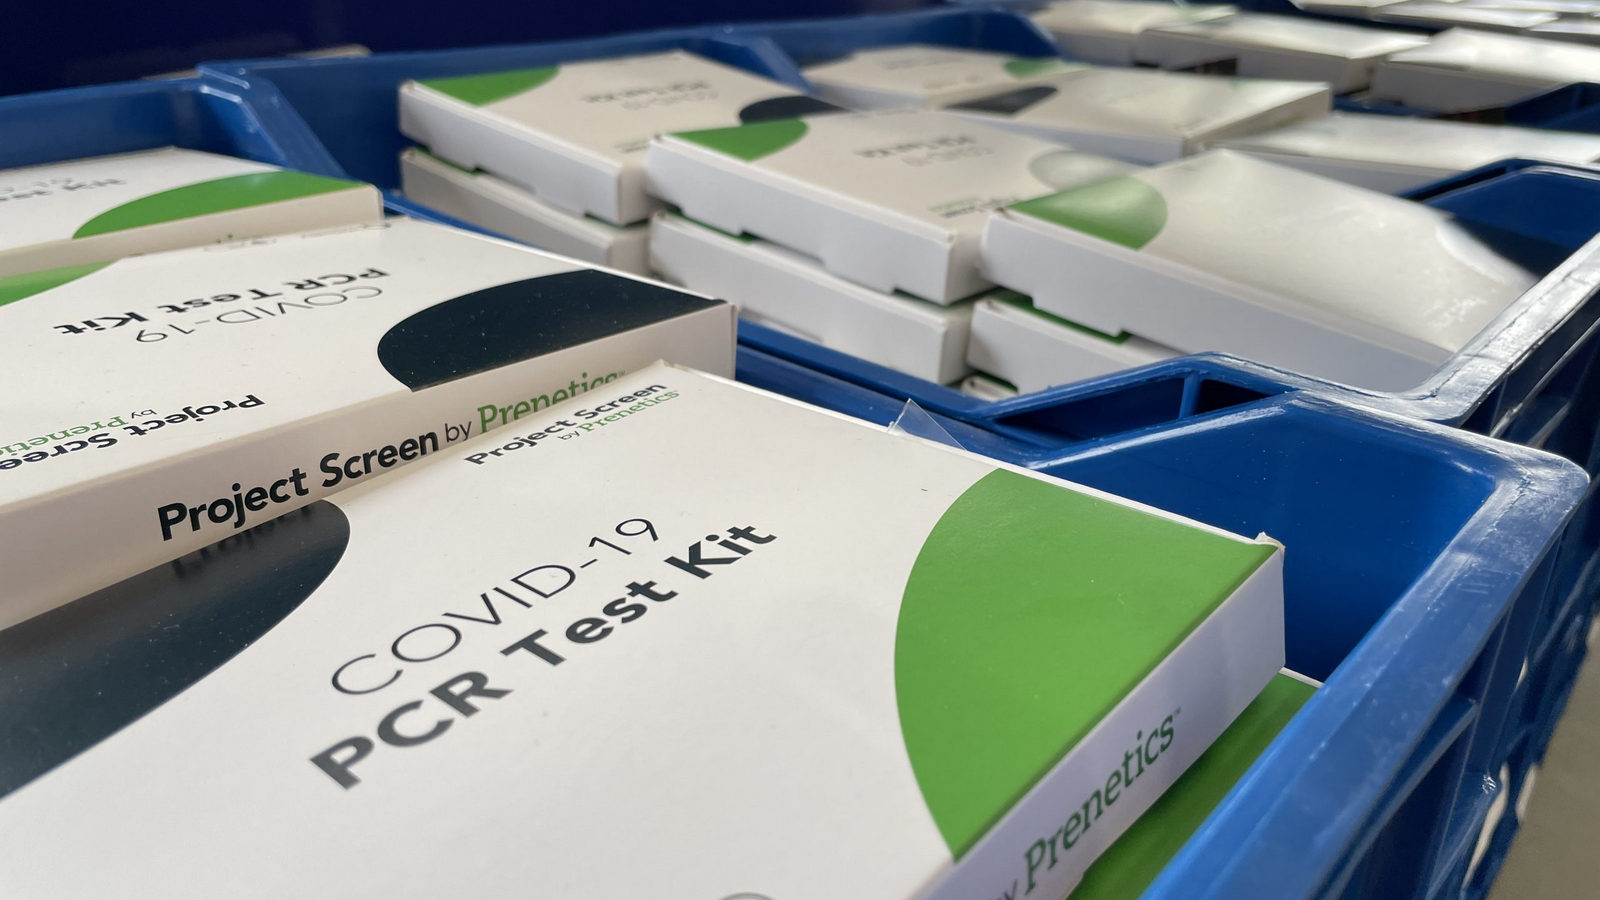
Manufactured product of Prenetics Global Limited

For genetic diagnostics leader Prenetics Global (PRE), the P/E ratio serves as an indicator of market confidence in future profits from DNA sequencing. This metric correlates the total business value with its net income, measuring the investment payback period. The company's monthly P/E dynamics visualize the asset valuation's sensitivity to changes in the cost of borrowed capital. A decline in this indicator signals that a fundamentally strong brand is undervalued amid tight monetary policy.

Key competitors

Price to Earnings Ratio A|Price to Earnings Ratio DGX (Quest Diagnostics Incorporated)|ILMN - Market Cap to Earnings|Price to Earnings Ratio Cologuard EXAS|Business Payback Period Revvity Corp (RVTY)|Bio-Rad Laboratories - P/E Multiple|Business Payback Period anbio.com NNNN|Sotera Health (SHC) - Price to Earnings Ratio|QDEL - Business Payback Period|Price to Earnings Ratio OPKO Corp|caredx.com - Market Cap to Net Income|Price to Earnings Ratio Maravai LifeSciences (MRVI)|FLGT (fulgentgenetics.com) - Company Value to Net Income|P/E Multiple LAB (Standard BioTools)|Cytek Biosciences Inc (CTKB) - Market Cap to Earnings|OSUR - Price to Earnings Ratio|XGN (Exagen Inc.) - Price to Earnings Multiple|MDXH: P/E Multiple|Market Cap to Earnings luciddx.com (LUCD)|Price to Earnings Ratio IMDX|TRIB (Trinity Biotech Corp) - Market Price to Net Income Ratio|P/E Multiple PRPH|Business Payback Period Ainos Corporation|P/E Multiple CODX (Co-Diagnostics, Inc.)|HSCS - Price to Earnings Ratio|BMRA - Price to Earnings Ratio|Business Payback Period Cardio Diagnostics CDIO|ONCO (Onconetix Corp) - Price to Earnings Ratio|Virax Biolabs Corp - Company Value to Net Income|BJDX (Bluejay Diagnostics) - P/E Multiple|AWH - Market Cap to Net Income Ratio|Price to Earnings Ratio Accelerate Diagnostics, Inc. (AXDX)|Price to Earnings Ratio CNTG (CENTOGENE)|Price to Earnings Ratio Enzo Biochem ENZ|Fresh2 Group Ltd (FRES) - Market Cap to Earnings|GTG Labs - P/E Multiple|ME: Price to Earnings Ratio|PMD: P/E Multiple