MKC McCormick & Company, Incorporated Gross Profit Margin
Official company branding of McCormick & Company, Incorporated (MKC)

McCormick & Company (MKC) leverages strong pricing power to pass rising raw material costs onto consumers. The GURU.Markets portal features a chart where the gross margin confirms profitability, with the indicator currently at 39.40. Success is driven by global distribution reach and control over retail shelf space, while stability is further bolstered by strategic alliances with fast-food chains and media personalities.

MKC - McCormick Gross Profitability over the range 07/04/2022 - 11/20/2026

Financial and market metric breakdowns for mccormickcorporation.com (MKC)
- market capitalization data:
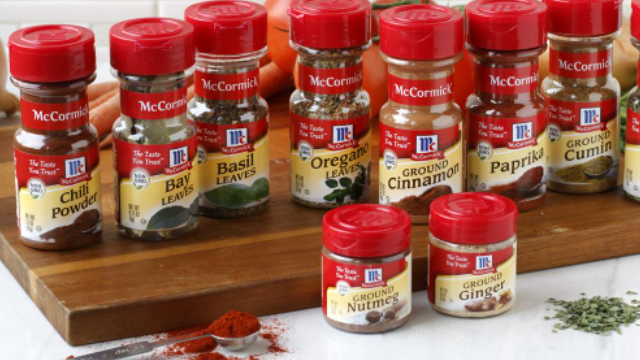
Core merchandise of McCormick & Company

McCormick & Company maintains global leadership in the spices segment through exclusive B2B contracts and retail dominance. The gross margin, which stands at 39.40, measures the portion of revenue remaining after deducting direct production costs, determining the efficiency of cost-of-goods-sold management. By analyzing the history of gross margins, an investor can see the business's ability to pass inflationary costs onto consumers. The stability of this metric confirms the company's fundamental resilience and pricing power.

Main competitors

Gross Profit Margin Kraft Heinz Company (KHC)|Gross Profitability Kellogg Company|Gross Profit Margin General Mills Corp GIS|Gross Margin JBS|Hormel Foods Corporation - Gross Return on Sales|The J. M. Smucker Company - Return on Gross Profit|PPC (Pilgrim's Pride Corporation) - Gross Profitability Margin|Campbell Soup - Gross Margin|Smithfield Foods, Inc. (SFD) - Return on Gross Profit|Ingredion (INGR) - Gross Profitability|LW (lambweston.com) - Gross Profitability|BRFS (BRF S.A.) - Gross Margin|Post Consumer Brands (POST) - Return on Sales by Gross Profit|Return on Gross Profit MZTI (T. Marzetti Company)|Gross Profitability BRBR (BellRing Brands Corp)|Gross Margin TR (Tootsie Roll Industries, Inc.)|Gross Profit Rate FLO|The Simply Good Foods - Gross Margin|Gross Profit Rate NOMD (Nomad Foods)|wkkellogg.com (KLG) - Gross Profitability|J&J Snack Foods Corp. (JJSF) - Gross Margin|UTZ (Utz) - Gross Margin|Gross Profit Margin TreeHouse Foods THS|Gross Margin STKL|Return on Sales by Gross Profit John B. Sanfilippo & Son, Inc.|Gross Profitability senecafoods.com SENEA|Lifeway Corp (LWAY) - Gross Profit Margin|MAMA: Return on Gross Profit|BGS (B&G Foods, Inc.) - Gross Return on Sales|BYND (Beyond Burger) - Return on Gross Profit|HAIN (The Hain Celestial Group) - Gross Profitability|Gross Profitability bridgford.com|Gross Return on Sales WYHG (Wing Yip Food Holdings)|Gross Margin LSF|Return on Sales by Gross Profit Borealis Foods|Gross Profitability Farmer Bros. FARM|Return on Sales by Gross Profit BranchOut Food Inc. (BOF)|PFAI - Gross Profitability|thisissowgood.com (SOWG) - Return on Gross Profit|TWG: Gross Margin|STKH - Return on Sales by Gross Profit|BSFC (Blue Star Foods Corporation) - Gross Margin|Whole Earth Brands (FREE) - Return on Sales by Gross Profit|Gross Profitability Lancaster Colony (LANC)|Real Good Food (RGF) - Gross Sales Margin|Gross Margin SNAX (Stryve Foods, Inc)|sovosbrands.com - Gross Profitability