MKC - McCormick & Company, Incorporated Market Capitalization-to-Revenue Ratio
Corporate company logo of McCormick & Company, Incorporated (MKC)

McCormick & Company (MKC) logistics rely on port diversification and the stockpiling of raw materials. The company's current P/S ratio demonstrates an evolution in the market valuation of the business, where 1.50 determines this specific parameter level. Production stability is ensured by a network of plants located in agricultural zones. However, inflation in glass and raw material prices, coupled with pressure from retailers, creates certain risks for margins.

McCormick & Co. (MKC) - Price-to-Revenue Ratio from 07/04/2022 to 11/13/2026

Analytical breakdowns for McCormick & Co. (MKC)
- stock price and consensus target price:
- market capitalization statistics:
Fundamental company analysis:MKC (mccormickcorporation.com)
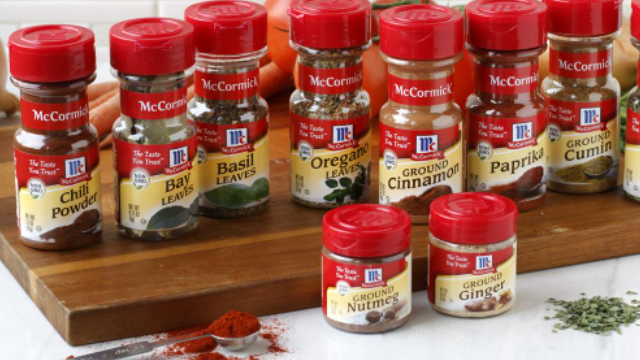
Mass-produced product of mccormickcorporation.com

This metric assesses the market value of the business relative to the volume of generated sales, allowing investors to identify an overbought asset through the sensitivity of capitalization to revenue. A stable price-to-sales ratio confirms the fundamental resilience of McCormick & Company (MKC), where high employee loyalty and a family culture ensure the predictability of operating income, which is reflected in the absence of abnormal fluctuations on this chart.

Competing companies

kraftheinzcompany.com - Market Cap to Revenue Ratio|Kellogg's - Market Cap to Revenue|Market Capitalization-to-Revenue Ratio GIS|JBS Group - P/S Multiple|Price-to-Sales Ratio HRL|The J. M. Smucker Company (SJM) - Price-to-Revenue Ratio|Price to Sales pilgrims.com (PPC)|Price-to-Revenue Ratio Campbell's|Price to Sales Smithfield SFD|P/S Multiple INGR|Lamb Weston Inc. - Market Cap to Revenue Ratio|Price-to-Revenue Ratio BRF S.A. BRFS|POST - Market Cap to Revenue|T. Marzetti - P/S Multiple|Premier Protein (BRBR) - Market Cap to Revenue|TR: P/S Multiple|Market Cap to Revenue Flowers Foods Corp|Price-to-Revenue Ratio Quest Nutrition|Price to Sales nomadfoods.com NOMD|Price-to-Revenue Ratio WK Kellogg (KLG)|JJSF (J&J Snack Foods Corp) - Market Capitalization-to-Revenue Ratio|Price-to-Revenue Ratio Utz Quality Foods UTZ|THS - Market Cap to Revenue|SunOpta Inc. - P/S Multiple|Price-to-Revenue Coefficient John B. Sanfilippo & Son JBSS|SENEA: P/S Multiple|Market Cap to Revenue Lifeway Foods Inc|Price-to-Revenue Ratio MamaMancini's|P/S Multiple B&G Foods Holding|Market Cap to Revenue BYND (Beyond Meat, Inc.)|HAIN (hain.com) - Market Capitalization-to-Revenue Ratio|BRID - Market Cap to Revenue Ratio|Market Cap to Sales Volume WYHG (Wing Yip Food Holdings Group)|LSF: Market Cap to Revenue|Market Capitalization-to-Revenue Ratio BRLS (borealisfoods.ca)|FARM: P/S Multiple|Market Cap to Revenue BranchOut Food|Price-to-Revenue Ratio Pinnacle Food Group Inc|Price to Sales Sow Good, Inc. SOWG|Price-to-Revenue Ratio Top Wealth Group Holding Ltd (TWG)|Market Cap to Revenue Steakholder Foods Corp STKH|Price-to-Revenue Ratio Blue Star Foods Corp. BSFC|FREE (Whole Earth Brands Inc.) - Price-to-Sales Ratio|Lancaster Colony Corporation - P/S Multiple|RGF - P/S Multiple|Stryve (SNAX) - Price-to-Revenue Ratio|Market Cap to Revenue Ratio SOVO