GIS General Mills Inc Gross Profit Margin
Official company branding of General Mills Corp (GIS)

The General Mills, Inc. (GIS) portfolio is based on high-demand food products, demonstrating exceptional stability during crises. The gross margin level illustrates the company's financial cushion, where 33.10 sets the current value of the metric. Strategy is shifting toward premium pet food and snacks, while the growth of the Blue Buffalo segment, combined with the ability to pass costs onto consumers, ensures dividend sustainability.

GIS - General Mills, Inc. Gross Margin over the range 07/04/2022 - 11/20/2026

Analytical breakdowns and data insights for company General Mills (GIS)
- stock value and consensus price forecast:
Fundamental valuation:GIS General Mills Inc
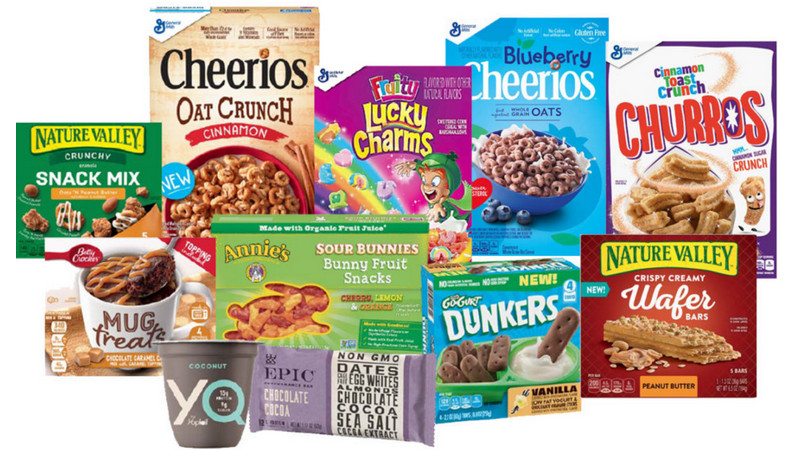
Signature product of generalmills.com

For a fundamental valuation of General Mills, Inc. (GIS), investors must determine the effectiveness of cost management. Gross margin measures the profit share after deducting direct production expenses, reflecting the business's ability to pass inflation onto consumers. By analyzing gross margin trends relative to sales, one can assess the success of the expansion into premium pet food and snacks. The stability of this metric confirms the strength of the brands within a saturated consumer market.

Main competitors

Gross Profit Margin Kraft Heinz Company (KHC)|Gross Profitability Kellogg Company|Gross Profit Margin McCormick & Co. MKC|Gross Margin JBS|Hormel Foods Corporation - Gross Return on Sales|The J. M. Smucker Company - Return on Gross Profit|PPC (Pilgrim's Pride Corporation) - Gross Profitability Margin|Campbell Soup - Gross Margin|Smithfield Foods, Inc. (SFD) - Return on Gross Profit|Ingredion (INGR) - Gross Profitability|LW (lambweston.com) - Gross Profitability|BRFS (BRF S.A.) - Gross Margin|Post Consumer Brands (POST) - Return on Sales by Gross Profit|Return on Gross Profit MZTI (T. Marzetti Company)|Gross Profitability BRBR (BellRing Brands Corp)|Gross Margin TR (Tootsie Roll Industries, Inc.)|Gross Profit Rate FLO|The Simply Good Foods - Gross Margin|Gross Profit Rate NOMD (Nomad Foods)|wkkellogg.com (KLG) - Gross Profitability|J&J Snack Foods Corp. (JJSF) - Gross Margin|UTZ (Utz) - Gross Margin|Gross Profit Margin TreeHouse Foods THS|Gross Margin STKL|Return on Sales by Gross Profit John B. Sanfilippo & Son, Inc.|Gross Profitability senecafoods.com SENEA|Lifeway Corp (LWAY) - Gross Profit Margin|MAMA: Return on Gross Profit|BGS (B&G Foods, Inc.) - Gross Return on Sales|BYND (Beyond Burger) - Return on Gross Profit|HAIN (The Hain Celestial Group) - Gross Profitability|Gross Profitability bridgford.com|Gross Return on Sales WYHG (Wing Yip Food Holdings)|Gross Margin LSF|Return on Sales by Gross Profit Borealis Foods|Gross Profitability Farmer Bros. FARM|Return on Sales by Gross Profit BranchOut Food Inc. (BOF)|PFAI - Gross Profitability|thisissowgood.com (SOWG) - Return on Gross Profit|TWG: Gross Margin|STKH - Return on Sales by Gross Profit|BSFC (Blue Star Foods Corporation) - Gross Margin|Whole Earth Brands (FREE) - Return on Sales by Gross Profit|Gross Profitability Lancaster Colony (LANC)|Real Good Food (RGF) - Gross Sales Margin|Gross Margin SNAX (Stryve Foods, Inc)|sovosbrands.com - Gross Profitability