ODP: ODP Corporation Price to Sales
Symbol and logo of brand OfficeMax (ODP)

Risks of revenue stagnation due to remote work formats and pressure from marketplaces are weighing on The ODP Corporation (ODP) shares. The P/S market multiple visualizes the extent to which the asset's value is supported by gross income, where 0.10 captures the current state of this parameter. Stable FCF is supported by the transition to a B2B platform, while cost optimization through the reduction of retail outlets ensures business scalability.

ODP: OfficeMax Price-to-Revenue Ratio 07/04/2022 - 12/20/2025

Metric breakdowns and analytics for OfficeMax (ODP)
- share price and consensus valuation forecast:
Summary company analytics:ODP Corp, ODP
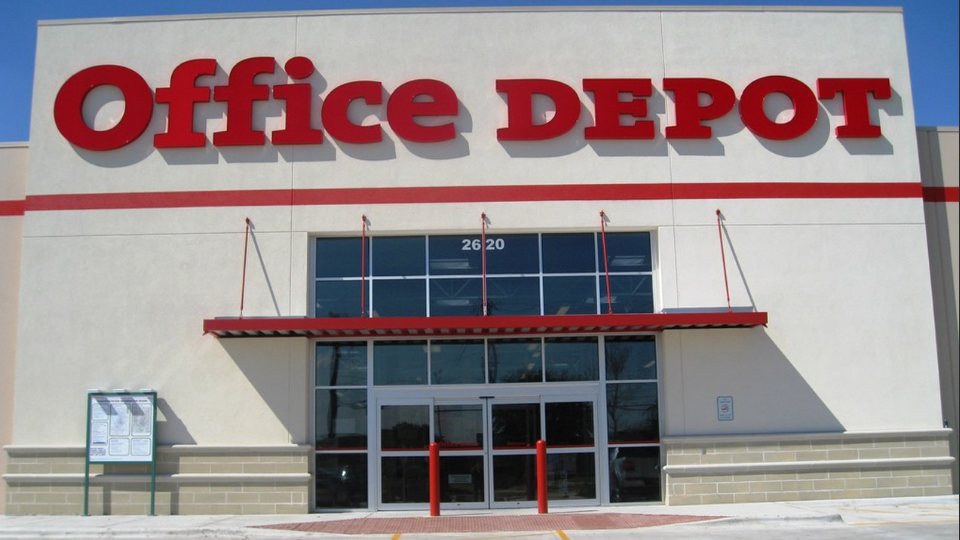
Manufactured products of Office Depot

The ODP Corporation (ODP) dependence on Asian electronics supplies impacts sales volumes, which is reflected in the dynamics of the P/S market multiple. This indicator correlates current market capitalization with annual revenue, allowing for an assessment of the value of each dollar of income; its growth above historical averages signals an overvaluation of the asset, while a decline indicates a potential undervaluation of the business amid operational risks.

Competing companies

FERG: Price-to-Sales Ratio|Price-to-Revenue Ratio Tractor Supply Corp TSCO|Pottery Barn - Price-to-Revenue Ratio|ULTA: Market Cap to Revenue|DG - P/S Multiple|DICK'S Sporting Goods, Inc. (DKS) - Price-to-Revenue Ratio|DLTR (Dollar Tree) - Price-to-Revenue Ratio|BBY (Best Buy Stores) - P/S Multiple|POOL: Market Capitalization-to-Revenue Ratio|Price-to-Revenue Ratio GameStop Corp (GME)|Price-to-Revenue Coefficient wayfair.com|Ollie's - Market Cap to Revenue|e.l.f. Beauty - Price-to-Revenue Ratio|FIVE - Price-to-Revenue Ratio|MUSA - P/S Multiple|MINISO Group Holding (MNSO) - Price-to-Revenue Ratio|Market Cap to Revenue Mattel|BBWI (Bath & Body Works Direct) - P/S Multiple|Restoration Hardware - Price-to-Sales Ratio|Price-to-Revenue Ratio Hayward Industries (HAYW)|ASO (Academy Sports and Outdoors) - Market Capitalization-to-Revenue Ratio|Savers Value Village - Market Cap to Revenue|P/S Multiple Hillman Solutions HLMN|WINA - Price-to-Revenue Ratio|Price-to-Sales Ratio UPBD|Sally Beauty Holdings Inc (SBH) - Price-to-Revenue Ratio|Market Cap to Revenue Ratio OLPX|Price-to-Revenue Ratio Latham Group|Yatsen Holding (YSG) - Price-to-Revenue Coefficient|P/S Multiple ARKO|RERE - Price to Sales|Price-to-Revenue Ratio Helen of Troy Limited Inc. HELE|Price-to-Revenue Coefficient Ennis Corp (EBF)|ACCO: Market Cap to Revenue|Price-to-Revenue Coefficient JAKKS Pacific JAKK|Envela Corp. (ELA) - Price-to-Revenue Ratio|PEW (GrabAGun) - Price-to-Revenue Ratio|Market Cap to Revenue ACU|Price-to-Revenue Ratio CLAR|Price-to-Revenue Ratio sportsmans.com (SPWH)|P/S Multiple 1stdibs.com (DIBS)|Price-to-Revenue Ratio Grove Collaborative Holdings GROV|lesliespool.com - Price-to-Revenue Ratio|MaxsMaking Corporation - P/S Multiple|thebrandhousecollective.com - Market Cap to Sales Volume|CRWS (Crown Crafts, Inc) - Market Cap to Revenue|Yoshitsu Co., Ltd (TKLF) - P/S Multiple|Price-to-Revenue Ratio Park Ha Biological Technology|aarons.com (AAN) - Price-to-Revenue Coefficient|Price-to-Revenue Ratio Big Lots, Inc (BIG)|Market Cap to Revenue Conn Appliances CONN|Price-to-Revenue Ratio Solo Brands, Inc. DTC|EFSH (1847holdings.com) - Price-to-Sales Ratio|KIRK - Price-to-Revenue Ratio|Market Capitalization-to-Revenue Ratio TCS (The Container Store Group, Inc.)|tupperwarebrands.com (TUP) - Price-to-Revenue Ratio|HIBB - Price-to-Revenue Coefficient