Ollie's Bargain Outlet Holdings Inc (OLLI): Price-to-Revenue Ratio
Symbol and logo of brand Ollie's Bargain Outlet Holdings Inc (OLLI)

Ollie's Bargain Outlet relies on large-scale procurement of undervalued assets, creating a unique "treasure hunt" format. On GURU.Markets, the price-to-sales ratio demonstrates capitalization dynamics relative to revenue, where the value of 2.00 serves as the current metric. The physical excitement of shoppers ensures high inventory turnover, while the trend toward frugal consumption combined with network expansion stimulates margin growth.

Ollie's - OLLI P/S Multiple (period 07/04/2022 - 11/14/2026)

Metric breakdowns and analytics for Ollie's Bargain Outlet Holdings Inc (OLLI)
- current quotes and average value forecast:
Summary company analytics:ollies.us, OLLI
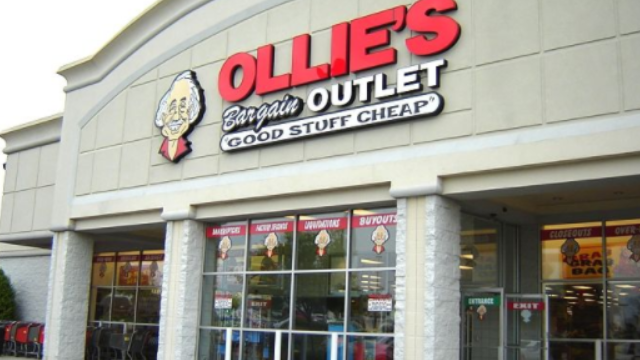
Mass-produced product of Ollie's Bargain Outlet

To objectively assess the operational efficiency of Ollie's Bargain Outlet (OLLI), investors must compare market capitalization with actual cash flow from sales. By analyzing the price-to-sales ratio, one can determine the extent of the premium paid for a discount retail business model, where stable demand for closeout merchandise in the Eastern U.S. states serves as the foundation for long-term share value.

Competing companies

FERG - Price to Sales|Price-to-Revenue Ratio Tractor Supply TSCO|Williams Sonoma - Price-to-Revenue Ratio|ULTA - Price-to-Revenue Ratio|DG: Price-to-Revenue Ratio|DKS: P/S Multiple|DLTR - Price-to-Revenue Coefficient|BBY (Best Buy) - P/S Multiple|Price to Sales Pool Corp POOL|Price-to-Revenue Ratio GameStop Stores (GME)|Price-to-Revenue Coefficient Wayfair LLC|e.l.f. Beauty, Inc. - Market Cap to Revenue|Market Capitalization-to-Revenue Ratio FIVE|Murphy USA - P/S Multiple|MNSO: Price-to-Revenue Ratio|MAT: P/S Multiple|L Brands (BBWI) - P/S Multiple|Price-to-Revenue Ratio RH Corp|HAYW: Market Capitalization-to-Revenue Ratio|P/S Multiple ASO|Savers (SVV) - Price-to-Revenue Multiple|P/S Multiple HLMN (Hillman)|P/S Multiple Once Upon A Child WINA|Upbound Group, Inc. - P/S Multiple|Price-to-Revenue Coefficient Sally Beauty Corp SBH|Olaplex (OLPX) - Price-to-Revenue Ratio|Market Cap to Revenue Ratio SWIM|Market Cap to Revenue ODP|YSG: Market Capitalization-to-Revenue Ratio|Price-to-Revenue Ratio Arko Corp. (ARKO)|RERE - Price to Sales|Helen of Troy - Market Cap to Revenue|P/S Multiple Ennis Inc EBF|ACCO: Market Cap to Revenue|JAKKS Pacific, Inc. - Market Cap to Sales Volume|envela.com (ELA) - Price-to-Revenue Ratio|PEW (grabagun.com) - Price-to-Revenue Ratio|ACU (Acme United Corp.) - P/S Multiple|Price to Sales Clarus CLAR|Market Cap to Revenue SPWH (Sportsmans Warehouse)|Market Cap to Sales Volume DIBS|Price-to-Revenue Ratio Grove Collaborative Holdings GROV|Leslie's Inc. (LESL) - Price to Sales|MAMK - Price-to-Revenue Ratio|TBHC: Price-to-Revenue Ratio|Crown Crafts, Inc (CRWS) - Price-to-Revenue Ratio|TKLF (Yoshitsu Corp) - Price-to-Revenue Ratio|PHH (Park Ha Biological Technology Co Ltd) - P/S Multiple|Aaron's, Inc. (AAN) - Price-to-Revenue Coefficient|Price-to-Revenue Ratio Big Lots (BIG)|CONN (Conn's HomePlus) - Market Capitalization-to-Revenue Ratio|P/S Multiple DTC (Solo Brands)|1847 Holdings Ltd (EFSH) - Price to Sales|KIRK: Market Cap to Revenue|containerstore.com - Market Cap to Sales Volume|TUP: P/S Multiple|Hibbett Sports (HIBB) - P/S Multiple