WINA: Winmark Corp. Price-to-Revenue Coefficient

Symbol and logo of brand Winmark Corp. (WINA)

Winmark Corporation dominates the second-hand franchising segment, creating a sustainable barrier to entry for new players. The company's normalized P/S helps filter market noise from actual turnover, where 10.60 represents the current metric. The model of buying items directly from individuals guarantees a constant influx of low-cost inventory. Profit growth is expected following the recovery of consumer purchasing power.

WINA (Winmark) Price-to-Revenue Ratio history from 07/04/2022 to 11/13/2026

Metric breakdowns and analytics for Winmark Corp. (WINA)
Fundamental company analysis:WINA winmarkcorporation.com
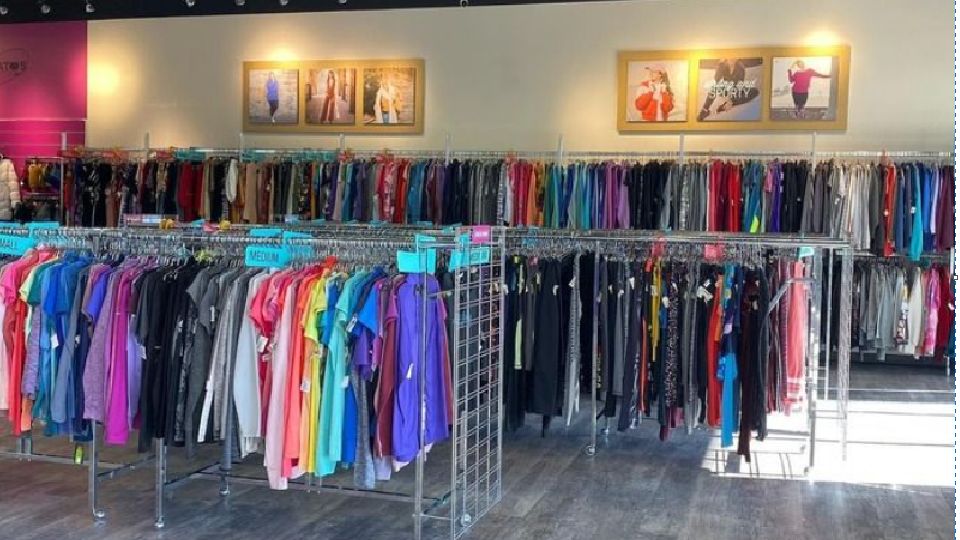
Signature product of Once Upon A Child

The efficiency of decentralized supplies and local warehouses at Winmark Corporation (WINA) directly impacts revenue stability, forming the basis for market value assessment. The P/S multiple compares business capitalization with sales volume, allowing investors to determine the premium paid for the generated cash flow by analyzing the current P/S valuation for deviations from historical averages.

Who Winmark Corporation competes with

Market Cap to Revenue fergusonplc.com FERG|P/S Multiple TSCO (Tractor Supply)|Price-to-Revenue Coefficient Williams Sonoma (WSM)|ULTA - Price-to-Revenue Ratio|DG (Dollar General Corp.) - Market Cap to Revenue Ratio|dickssportinggoods.com (DKS) - Price-to-Revenue Ratio|Market Cap to Revenue dollartree.com|BBY (Best Buy) - P/S Multiple|P/S Multiple Pool Corp|Price-to-Revenue Ratio GameStop Stores (GME)|W (Wayfair LLC) - Market Capitalization-to-Revenue Ratio|Price-to-Revenue Ratio Ollie's Bargain Outlet OLLI|P/S Multiple elfcosmetics.com ELF|FIVE: Market Cap to Revenue|Market Capitalization-to-Revenue Ratio MUSA (Murphy USA Inc)|MNSO: P/S Multiple|Market Cap to Revenue Mattel Toys|Price-to-Revenue Ratio Bath & Body Works, Inc.|Price to Sales Restoration Hardware Inc. RH|Price-to-Revenue Ratio Hayward (HAYW)|ASO (Academy Sports and Outdoors, Inc.) - Market Capitalization-to-Revenue Ratio|Price-to-Revenue Ratio Value Village SVV|HLMN (Hillman Corp) - Price-to-Sales Ratio|UPBD - Price-to-Revenue Ratio|Price to Sales Sally Beauty Corp|Olaplex (OLPX) - Price-to-Revenue Ratio|Latham Pool Products - Market Capitalization-to-Revenue Ratio|ODP (OfficeMax) - P/S Multiple|P/S Multiple Yatsen Corp|Market Cap to Revenue ARKO (Arko Corp.)|Market Cap to Sales Volume RERE|P/S Multiple HELE (Helen of Troy)|Price-to-Revenue Coefficient Ennis Inc (EBF)|ACCO - Price-to-Revenue Ratio|Price to Sales JAKKS Pacific, Inc.|envela.com (ELA) - Price-to-Revenue Ratio|Market Cap to Revenue Ratio PEW|Market Cap to Revenue ACU|Market Cap to Revenue Clarus (CLAR)|P/S Multiple SPWH|Price-to-Revenue Coefficient 1stdibs.com|Price-to-Revenue Ratio Grove Collaborative Holdings GROV|LESL: Market Cap to Revenue Ratio|MaxsMaking - P/S Multiple|TBHC - P/S Multiple|Crown Crafts, Inc (CRWS) - Price-to-Revenue Ratio|Yoshitsu Corp - Market Capitalization-to-Revenue Ratio|PHH (Park Ha Biological Technology Co Ltd) - P/S Multiple|Price to Sales Aaron's, Inc. AAN|Market Cap to Revenue BIG (Big Lots)|Market Cap to Sales Volume CONN|P/S Multiple DTC (Solo Brands)|P/S Multiple 1847 Holdings Ltd EFSH|Kirkland's, Inc. - P/S Multiple|Price-to-Revenue Coefficient containerstore.com TCS|Tupperware (TUP) - Price-to-Revenue Ratio|HIBB (Hibbett Sports) - Price-to-Revenue Ratio