prenetics.com (PRE) - Cash Funds Calculated per Share

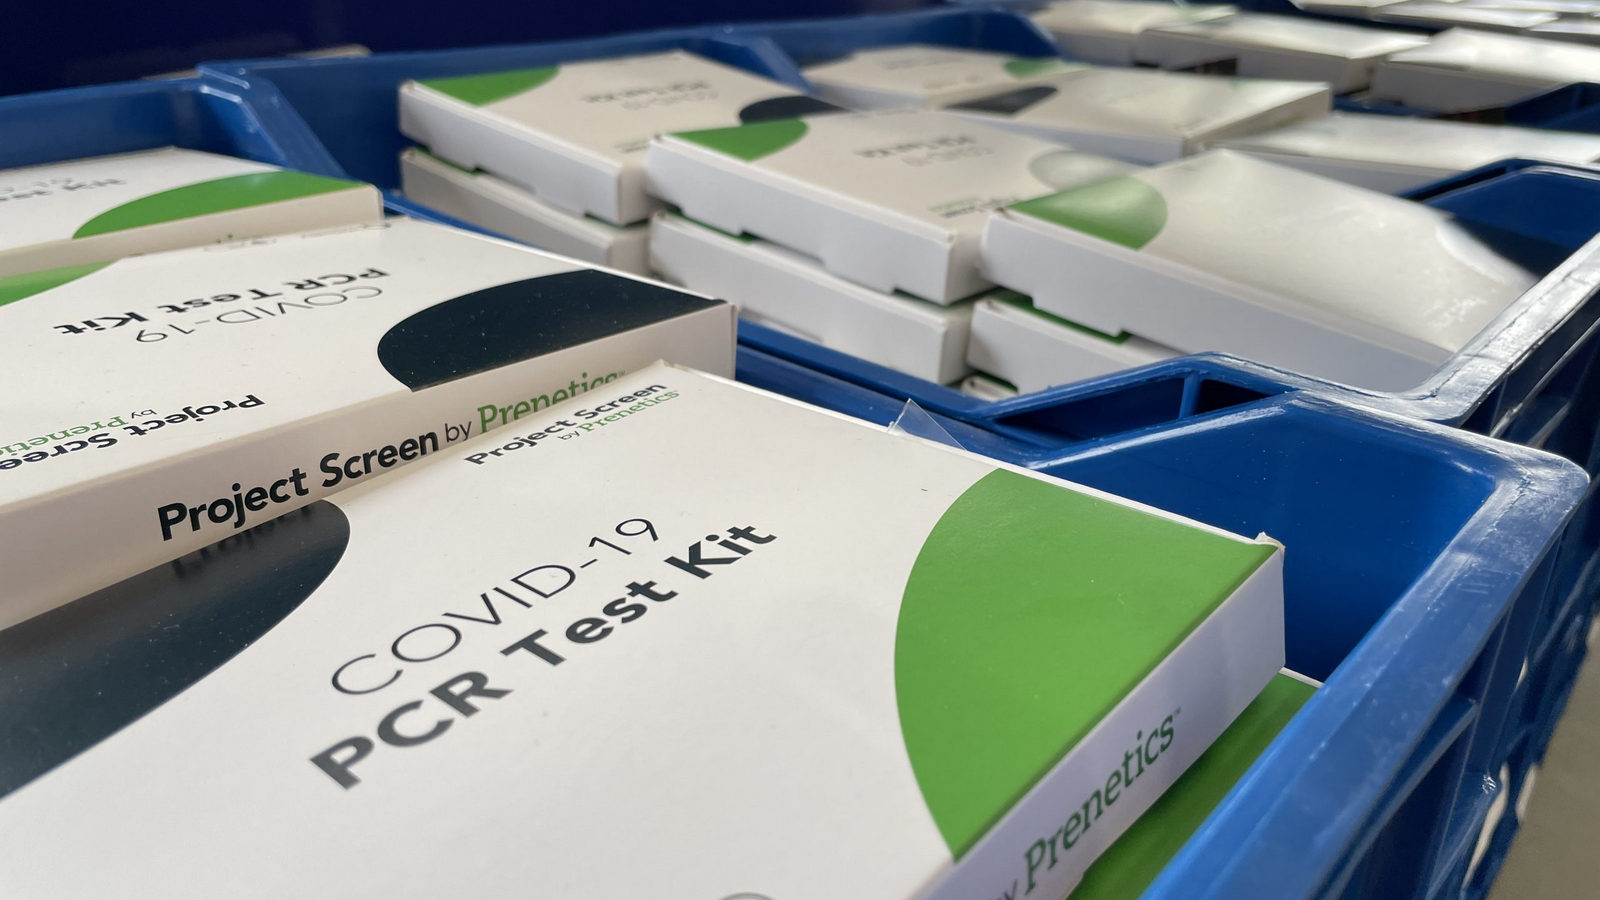
Diversification through home tests and a global laboratory network reduces risks for Prenetics Global (PRE), while the change in cash per share on GURU.Markets confirms the resilience of the model. The 6.52 level captures fresh liquidity values supported by stable sales in Asia. An ecological approach to diagnostics and strict bioethics complement the patient data security strategy.

Comprehensive metric breakdowns and analytics for Prenetics Global (PRE)
- share price and consensus valuation forecast:
- market capitalization indicators:
- book capitalization data:
- debt and solvency information:
- company profitability and valuation multiples indicators:
PRE - Net Profit|Projected Future Earnings Prenetics Global|PRE - Price to Earnings Ratio|Future Price to Earnings prenetics.com|PRE - Price/Earnings to Growth Ratio|Company Value to Operating Income Before Depreciation Ratio Prenetics Global Ltd|PRE - Profit before payment of interest, taxes and amortization|Earnings per share for the trailing year Prenetics|PRE - Net earnings per share (EPS TTM)|Earnings per share growth in annualized terms for the last twelve months prenetics.com|PRE - Earnings per share growth in current year|Expected earnings per share growth for next year Prenetics Global
- sales volume and revenue indicators:
- margin metrics data:
- cash and cash flow data:
Comprehensive company analysis:Prenetics Global Limited
This indicator determines the volume of liquid assets per ordinary share by dividing the total cash balance by the number of shares outstanding. By analyzing the cash-per-share structure, an investor assesses the ability of Prenetics Global (PRE) to fund expansion into new medical niches and maintain operational resilience amid declining demand for diagnostics.
Analysis of competing companies
A: Amount of Cash per Share|Cash per Share DGX|Cash Funds Calculated per Share illumina.com|Cash Funds per Share Exact Sciences Corp EXAS|PerkinElmer (RVTY) - Cash on Hand per Share|BIO - Cash Funds per Share|Cash Funds Calculated per Share Anbio Corp NNNN|SHC: Cash per Share|QDEL: Cash Calculated per Single Share|OPK (OPKO Health) - Cash per Share|Cash per Single Share caredx.com (CDNA)|Cash per Share MRVI|Fulgent Corp - Cash Funds per Single Share|Fluidigm - Cash per Single Share|Cash Funds Calculated per Share Cytek Biosciences, Inc. (CTKB)|OSUR - Cash Funds per Share|XGN (Exagen) - Cash Funds per Single Share|MDXH: Cash per Share|LUCD: Cash Calculated per Single Share|Cash Funds per Share Insight Molecular Diagnostics|TRIB: Amount of Cash per Share|Cash Funds per Share ProPhase (PRPH)|AIMD - Cash on Hand per Share|Cash Funds per Share Co-Diagnostics, Inc. CODX|Cash per Share Heart Test Laboratories HSCS|Biomerica Inc - Cash per Share|Cash Funds Calculated per Share cardiodiagnosticsinc.com CDIO|Onconetix Inc (ONCO) - Cash Funds per Share|Cash Money per Share VRAX (Virax Biolabs Group Ltd)|BJDX (Bluejay) - Cash per Share|Cash per Share Aspira Women's Health|Cash per Share AXDX|CENTOGENE - Cash Funds per Single Share|Cash per Share ENZ (enzo.com)|Cash per Share Fresh2 Group Ltd FRES|GENE - Cash Funds per Share|ME (23andMe Inc.) - Cash Funds per Single Share|PMD: Cash per Share
