PTPI: Petros Company Value to Net Income

Corporate emblem and logo of Petros Pharmaceuticals Inc (PTPI)

The market value dynamics of Petros Pharmaceuticals (PTPI) demonstrate a current P/E ratio of -0.10. The business relies on cloud IT solutions for medication accounting and packaging robotics, which reduces personnel costs. Revenues are growing through online sales of men's health products. However, a lack of unique advantages is leading to a loss of market share due to the expansion of digital service behemoths and pricing wars.

PTPI Petros Pharma: Price to Earnings Ratio in the range 07/04/2022 - 05/24/2025

Comprehensive metric breakdowns and analytics for Petros Pharmaceuticals Inc (PTPI)
- price and consensus price forecast:
- market capitalization information:
Comprehensive company analysis:Petros Pharmaceuticals Inc - PTPI
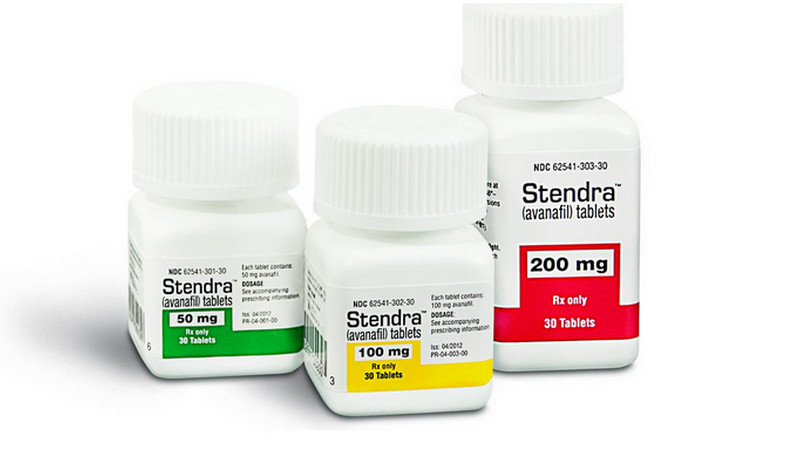
Flagship merchandise of Petros Pharmaceuticals, Inc.

The P/E ratio determines the market value of a single unit of profit, reflecting investor expectations regarding business growth rates. For Petros Pharmaceuticals (PTPI), this parameter measures the market's willingness to pay for proprietary drug protection. Analyzing the price-to-earnings ratio trend reveals the impact of generic expansion and telemedicine on capitalization. A declining multiple indicates a reassessment of distribution risks, serving as an indicator of the asset's fundamental attractiveness.

Analysis of competing companies

HLN: Company Value to Net Income|Price to Earnings Ratio KVUE (Kenvue Corp)|VRNA (Verona Pharma Inc.) - Company Value to Net Income|Price to Earnings Ratio Jyong Biotech Limited MENS|Ligand (LGND) - Market Cap to Earnings|AMRX: Price to Earnings Ratio|Perrigo - Market Price to Net Income Ratio|ALVO: P/E Multiple|Liquidia Technologies - Company Value to Net Income|GLPG (Galapagos N.V.) - P/E Multiple|Market Cap to Earnings anipharmaceuticals.com ANIP|Price to Earnings Ratio MannKind (MNKD)|AMPH (Amphastar Pharmaceuticals, Inc.) - Company Value to Net Income|Price to Earnings Ratio Pacira BioSciences, Inc. PCRX|P/E Multiple ARS Corp SPRY|Theravance Biopharma - P/E Multiple|Market Cap to Net Income Ratio Aquestive Therapeutics, Inc. (AQST)|scPharmaceuticals (SCPH) - Price to Earnings Ratio|Price to Earnings Ratio Tectonic Therapeutic, Inc.|TNXP (Tonix Pharmaceuticals Holding) - P/E Multiple|Price to Earnings Multiple SXTC (China SXT Pharmaceuticals)|P/E Multiple EPRX|P/E Multiple bioharvest.com (BHST)|Price to Earnings Ratio Invizyne Technologies EXOZ|ORMP: Price to Earnings Multiple|ENTX: Price to Earnings Ratio|HYFT: Price to Earnings Ratio|ABVC BioPharma Inc. (ABVC) - Price to Earnings Ratio|cumberlandpharma.com (CPIX) - P/E Multiple|QNTM (Quantum BioPharma) - P/E Multiple|FGEN: Company Value to Net Income|P/E Multiple TELO|P/E Multiple Rani Therapeutics Holdings (RANI)|P/E Multiple SNYR (Synergy CHC Corp)|Rallybio Corporation (RLYB) - Market Cap to Earnings|LEXX - Price to Earnings Ratio|PULM (Pulmatrix) - Price to Earnings Multiple|Pheton Holdings Ltd (PTHL) - Price to Earnings Ratio|Aptorum - Company Value to Net Income|Price to Earnings Ratio LYRA|Price to Earnings Ratio Impact BioMedical Inc (IBO)|P/E Multiple TNFA|YCBD: Market Cap to Net Income|Price to Earnings Ratio PainReform PRFX|altamiratherapeutics.com (CYTO) - Market Cap to Earnings|LIPO: Price to Earnings Ratio|OPTN (optinose.com) - Price to Earnings Multiple|PIRS: P/E Multiple|PROC - Business Payback Period|Price to Earnings Ratio Qilian International Holding Group Limited|SLRN: Company Value to Net Income|Price to Earnings Ratio TFFP (TFF Pharma)