Vicarious Surgical Inc (RBOT) - Market Cap to Earnings

Corporate emblem and logo of Vicarious Surgical (RBOT)

The Vicarious Surgical Inc. (RBOT) price chart helps assess the trajectory for creating surgical VR systems and implementing AI analytics, with a PE ratio of -0.20. The business relies on modernized assembly plants for high-precision devices. Simultaneously, management is refining portable robots for abdominal surgeries, aiming to achieve FDA certification and transform modern medicine.

Vicarious Surgical Inc (RBOT): Price to Earnings Ratio from 07/04/2022 to 03/07/2026

Comprehensive metric breakdowns and analytics for vicarioussurgical.com (RBOT)
General company analysis:Vicarious Surgical Inc - RBOT
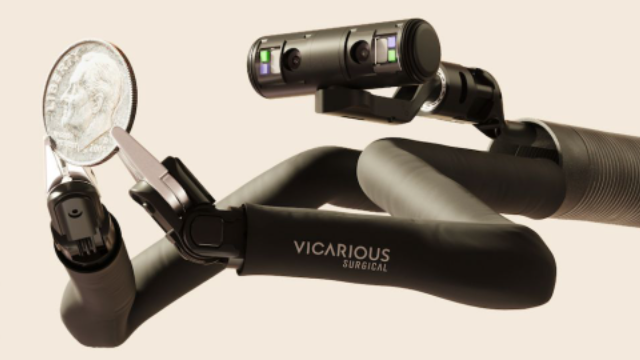
Manufactured product of Vicarious Surgical Inc.

The P/E ratio reflects the market value of one dollar of earnings, allowing an investor to assess the degree of overpayment for an asset amid an inflationary lag. By analyzing the median P/E of Vicarious Surgical Inc. (RBOT), one can correlate market expectations with the sales potential of robotic systems in major clinics, where demand for minimally invasive technologies determines the issuer's future capitalization.

Analysis of competing companies

Dexcom - Market Cap to Net Income|Price to Earnings Ratio PEN (Penumbra Inc)|NOVT - Market Cap to Earnings|Haemonetics Corp. - Price to Earnings Ratio|P/E Multiple Inspire Medical Systems, Inc. INSP|PRCT: Price to Earnings Ratio|CONMED - Market Price to Net Income Ratio|PLSE: P/E Multiple|INMD - Business Payback Period|Price to Earnings Ratio PMI|Price to Earnings Ratio Surmodics (SRDX)|Price to Earnings Ratio SENS (Senseonics Holdings, Inc.)|NPCE (NeuroPace Inc) - Company Value to Net Income|Price to Earnings Ratio Tactile Systems Technology TCMD|SNWV - Price to Earnings Ratio|outsetmedical.com - P/E Multiple|Market Cap to Earnings smartvest.com|LNSR: P/E Multiple|Price to Earnings Multiple RCEL|PROF (Profound Medical) - P/E Multiple|Baird Medical Investment (BDMD) - Business Payback Period|P/E Multiple EDAP|Price to Earnings Ratio Apyx Medical Corporation APYX|P/E Multiple ICCM (IceCure Medical Ltd.)|P/E Multiple Pulmonx Corporation LUNG|TELA - Price to Earnings Ratio|CTSO: Price to Earnings Ratio|SRTS (Sensus Healthcare, Inc.) - Price to Earnings Ratio|Zynex, Inc. - Company Value to Net Income|ECOR (electroCore Inc) - P/E Multiple|Market Cap to Earnings inspira-technologies.com IINN|Price to Earnings Ratio ICU (SeaStar Medical Holding Corporation)|IRIDEX Corp. (IRIX) - Market Cap to Net Income Ratio|Intelligent Bio Solutions Inc - Price to Earnings Ratio|P/E Multiple AINostix XAIR|Profusa Inc. - P/E Multiple|Business Payback Period STRATA Skin Sciences, Inc. SSKN|GlucoTrack (GCTK) - Price to Earnings Ratio|Market Cap to Net Income NAOV (NanoVibronix Inc.)|Price to Earnings Ratio venusconcept.com|Price to Earnings Ratio Nuwellis, Inc. (NUWE)|P/E Multiple AEMD|ASXC - Market Cap to Earnings|Price to Earnings Ratio Avinger, Inc. AVGR|BSGM: Price to Earnings Multiple|CUTR: Price to Earnings Ratio|KNW - P/E Multiple|NARI: P/E Multiple|Price to Earnings Multiple NVRO|RSLS (ReShape Lifesciences, Inc.) - P/E Multiple|Silk Road Medical Inc (SILK) - Business Payback Period