Smart Sand Inc - SND Total Company Value-to-Revenue Ratio

High barriers to entry driven by licensing and logistics protect the business of Smart Sand, Inc. (SND) from competition. The EV/Sales multiple clearly demonstrates the market's valuation of management efficiency, where the indicator stands at 568.61. The company's revenues are based on sand consumption by shale operators, although the current liquidity shortage resulting from falling demand is creating certain financial pressure.

SND (Smart Sand Inc): analytical breakdowns and indicator data
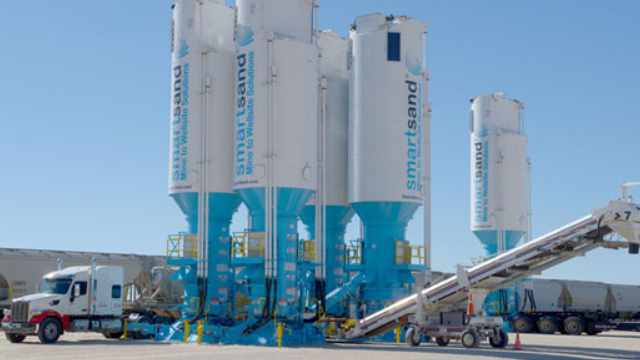
For Smart Sand, Inc. (SND), whose business depends on drilling volumes in shale basins and logistics costs, the EV/Sales history allows for a business valuation that accounts for net debt relative to generated revenue streams. Analyzing this trend helps investors determine the fairness of the market capitalization by eliminating debt distortions and assessing the sustainability of the company's valuation amid industry-wide sand overproduction.
