SYBT - Stock Yards Bancorp Inc Market Cap to Sales Volume

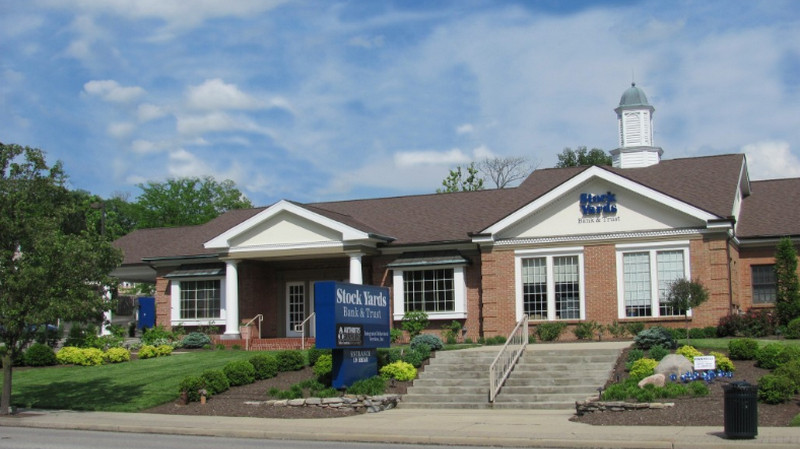
Corporate company logo of Stock Yards Corp (SYBT)

IT infrastructure updates to optimize online services define the current strategic direction of Stock Yards Bancorp (SYBT). Current P/S dynamics reflect the market valuation of revenue, where 4.10 represents the current level of the metric. The business foundation rests on a reliable retail network and diversified trust flows. Management's conservative approach in Indiana and Kentucky ensures a steady increase in dividends through the expansion of commercial lending.

SYBT Stock Yards Bank & Trust P/S Multiple (07/04/2022 - 11/13/2026)

Stock Yards Bancorp Inc (SYBT) - metric breakdowns and financial figures
- price and consensus price forecast:
Summary company analytics:SYBT - syb.com
Signature product of Stock Yards Corp

Stock Yards Bancorp's conservative focus on commercial lending and capital management across the Midwest requires a precise assessment of revenue generation efficiency. By analyzing the price-to-sales multiple, an investor compares market capitalization with sales volume, which helps identify fair price corridors and avoid false entries during temporary asset undervaluation.

Competing companies

Price-to-Revenue Coefficient bancfirst.bank|TFS Financial Corporation - Market Cap to Revenue|Market Cap to Sales Volume CBU (Community Bank)|TOWN - Price-to-Revenue Ratio|Price to Sales NBT Corp|FBNC: P/S Multiple|Market Cap to Revenue dime.com|Price-to-Revenue Ratio Bank First|P/S Multiple Community Trust Bancorp, Inc.|Market Cap to Revenue BHRB (Burke & Herbert Bank & Trust Company)|SBSI (Southside Corp) - Market Capitalization-to-Revenue Ratio|Equity Bancshares, Inc. - Market Cap to Revenue|cnbbank.bank (CCNE) - Price to Sales|Capital City Bank Group - P/S Multiple|TRST - P/S Multiple|HomeTrust Bancshares, Inc. (HTB) - Price-to-Revenue Ratio|Mid Penn Corp - Market Capitalization-to-Revenue Ratio|FSBC (Five Star Bancorp) - P/S Multiple|Market Cap to Revenue Ratio ORRF (orrstown.com)|Price-to-Revenue Ratio NB Bancorp (NBBK)|Price-to-Revenue Coefficient First Community Bank|Independent Bank Corp - Market Cap to Revenue|Market Capitalization-to-Revenue Ratio SPFI|Northpointe Bancshares - P/S Multiple|SMBC: Price-to-Revenue Ratio|HTBK: P/S Multiple|hinghamsavings.com (HIFS) - P/S Multiple|Price-to-Revenue Ratio HarborOne Bancorp Inc|Market Cap to Revenue Ratio SHBI (Shore Corp)|P/S Multiple TCBX|Market Cap to Revenue farmersbankgroup.com FMNB|Price-to-Revenue Ratio Bar Harbor Bank & Trust BHB|Unity Bancorp (UNTY) - Price to Sales|PFIS - Price-to-Revenue Ratio|Market Capitalization-to-Revenue Ratio PGC (Peapack-Gladstone Corp)|Northfield Bancorp (NFBK) - Price-to-Revenue Ratio|Price-to-Sales Ratio ACNB (acnb.com)|Price-to-Revenue Ratio Flushing Bank|Bridgewater Bancshares, Inc. (BWB) - Price-to-Revenue Coefficient|Market Cap to Revenue BSVN (Bank7 Inc.)|COFS - Price to Sales|P/S Multiple CARE (Carter Bankshares, Inc.)|home24bank.com - Price-to-Revenue Ratio|KRNY: Market Cap to Revenue|First Bank New Jersey - Market Cap to Sales Volume|communitywest.com (CWBC) - Price-to-Revenue Ratio|CIVB (Civista Corp) - Price-to-Revenue Ratio|Price-to-Revenue Ratio Greene County Bancorp|Price to Sales bankofmarin.com BMRC|P/S Multiple BRBS|Market Cap to Revenue Ponce Bank PDLB|P/S Multiple FMAO (Farmers & Merchants Bancorp Inc)|P/S Multiple Orange County Corp OBT|WTBA - Price-to-Revenue Ratio|PBFS: Price-to-Revenue Ratio|BCML (United Business Bank) - Market Cap to Revenue|Avidia Bancorp, Inc. - Market Capitalization-to-Revenue Ratio|FSBW (FS Bancorp Inc) - P/S Multiple|Price-to-Revenue Ratio CZNC|P/S Multiple PCB|P/S Multiple colony.bank (CBAN)|Price-to-Revenue Ratio Plumas Bank PLBC|FNLC: Market Cap to Revenue Ratio|NECB - Price-to-Revenue Ratio|JMSB - P/S Multiple|timberlandbank.com (TSBK) - Price-to-Revenue Ratio|WSBF - Price-to-Revenue Coefficient|Price-to-Revenue Ratio LINKBANK|Parke Bancorp (PKBK) - Price-to-Revenue Coefficient|Market Cap to Revenue FDBC (Fidelity D&D Bancorp)|Market Cap to Sales Volume MBCN|Price-to-Revenue Ratio Chemung Financial Corp. CHMG|westfieldbank.com (WNEB) - Price to Sales|Wayne Bank - P/S Multiple|FVCBankcorp (FVCB) - Market Cap to Revenue|FB Bancorp Inc (FBLA) - Price-to-Revenue Ratio|Oak Valley Bancorp. (OVLY) - P/S Multiple|Market Cap to Revenue PVBC|LCNB: Market Capitalization-to-Revenue Ratio|Market Cap to Revenue FCCO (First Community)|BPRN - Price to Sales|P/S Multiple HWBK (Hawthorn Bancshares, Inc.)|P/S Multiple Farmers and Merchants Trust Company FRAF|VABK - Price-to-Revenue Ratio|Market Capitalization-to-Revenue Ratio OPBK (OP Bancorp)|FXNC: P/S Multiple|Market Cap to Revenue Ratio CBNA|Price-to-Revenue Ratio Bank of Clarke|Blue Foundry Bancorp Inc (BLFY) - Price-to-Revenue Coefficient|Market Cap to Revenue FSFG (First Savings Financial)|ATLO (amesnational.com) - Market Capitalization-to-Revenue Ratio|P/S Multiple PEBK (Peoples Bancorp)|CB Financial Services Inc. - Price-to-Revenue Ratio|BayVanguard Bank - P/S Multiple|UBFO - P/S Multiple|MainStreet Bancshares (MNSB) - Price-to-Revenue Ratio|Market Cap to Revenue Ratio HNVR|CZWI (Citizens Community Bancorp, Inc.) - P/S Multiple|Market Cap to Revenue CF Bankshares, Inc. (CFBK)|Price-to-Revenue Ratio First Bank Richmond (RMBI)|FCAP - Price to Sales|Price-to-Revenue Ratio BCB Bancorp, Inc. BCBP|Market Capitalization-to-Revenue Ratio ECBK|EBMT - Price-to-Revenue Ratio|Price-to-Sales Ratio FNWD|rhinebeckbank.com (RBKB) - Price-to-Revenue Ratio|SBFG - Price-to-Revenue Coefficient|Market Cap to Revenue AFBI|Price to Sales First Guaranty Bancshares Inc. FGBI|P/S Multiple SRBK|Price-to-Revenue Ratio BSBK (bogotasavingsbank.com)|Union Bankshares - Market Cap to Revenue|Market Cap to Sales Volume SFBC (Sound Financial)|MGYR - Price-to-Revenue Ratio|RVSB: Price-to-Revenue Ratio|Lake Shore Savings Bank (LSBK) - Price-to-Revenue Ratio|Price to Sales Pathfinder Bank (PBHC)|CFSB (CFSB Bancorp) - P/S Multiple|Market Cap to Revenue Auburn National Bank (AUBN)|P/S Multiple IROQ|P/S Multiple unitedbancorp.com (UBCP)|Price-to-Revenue Ratio Summit State Bank, Inc. SSBI|Fifth District Bank - Price-to-Revenue Ratio|FUSB: Market Cap to Revenue|Market Capitalization-to-Revenue Ratio BOTJ (Bank of the James)|CPBI: P/S Multiple|BYFC (broadwayfederalbank.com) - Price-to-Revenue Ratio|NSTS (North Shore Trust and Savings) - P/S Multiple|P/S Multiple Catalyst Bancorp Inc.|Price-to-Revenue Ratio First Seacoast Bancorp (FSEA)|AmeriServ Financial Corp - Market Cap to Revenue Ratio|Price-to-Revenue Ratio PB Bankshares Inc PBBK|P/S Multiple optimumbank.com OPHC|TCBS - Price-to-Revenue Ratio|Price-to-Revenue Coefficient Home Federal Bancorp, Inc. HFBL|bayfirstfinancial.com (BAFN) - Price-to-Revenue Ratio|MBBC - Price-to-Revenue Coefficient|Market Cap to Revenue KFFB|GLBZ (Glen Burnie Bank) - Market Cap to Sales Volume|Price-to-Revenue Ratio Carver Bancorp, Inc. (CARV)|BRKL - Price to Sales|P/S Multiple EBTC (Enterprise Bank)|ESSA - Market Cap to Revenue|EVBN - Price-to-Revenue Ratio|FBMS - P/S Multiple|FLIC (fnbli.com) - Market Cap to Revenue|HMN Financial - Market Capitalization-to-Revenue Ratio|Market Cap to Revenue HTBI|Price to Sales Independent Bank Group Inc. IBTX|P/S Multiple MCBC|P/S Multiple oldpoint.com (OPOF)|Price-to-Revenue Ratio Penns Woods Bancorp, Inc. PWOD|Market Capitalization-to-Revenue Ratio SASR|Territorial Savings Bank - P/S Multiple|VBFC (Village Bank & Trust) - Market Cap to Revenue Ratio|William Penn Bank (WMPN) - Price-to-Revenue Ratio|BCOW - Price-to-Revenue Coefficient|Market Cap to Revenue SSBK