CZNC: Citizens & Northern Corporation Inc. Price-to-Revenue Coefficient

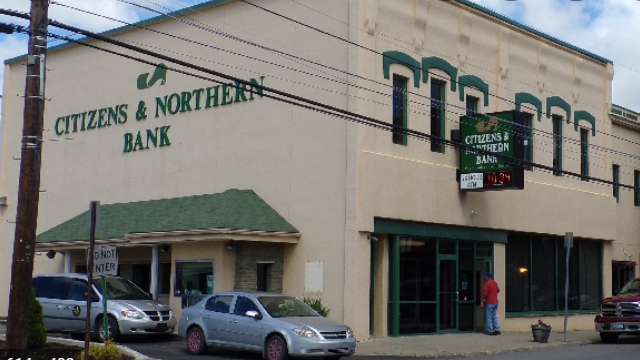
Brandmark of C&N Bank (CZNC)

How can margins be maintained amid low pricing power and mortgage stagnation? The answer lies in operating within the Pennsylvania market, where Citizens & Northern (CZNC) avoids external shocks, remaining dependent only on Fed policy. Conservative management ensures stable payouts, and this chart provided by the GURU.Markets platform shows that the revenue multiple has recorded 2.50 as the current metric.

CZNC - Citizens & Northern Corporation P/S Multiple over the range 07/04/2022 - 11/13/2026

Analytical breakdowns for Citizens & Northern Corp (CZNC)
- market price and analyst price targets:
Fundamental company analysis:cnbankpa.com (CZNC)
Flagship merchandise of Citizens & Northern Corporation

The P/S ratio compares the market capitalization of Citizens & Northern (CZNC) to its annual revenue, determining the cost of each dollar of income and the level of price sensitivity to sales volumes. By analyzing the P/S chart, an investor assesses the fundamental undervaluation of the asset, which, combined with the bank's low employee turnover, confirms the resilience of the business model and the conservative reliability of the issuer's operational structure.

Competitors of Citizens & Northern

Market Cap to Revenue bancfirst.bank BANF|P/S Multiple TFSL (TFS Financial Corporation)|Price-to-Revenue Coefficient Community Bank (CBU)|TOWN: Market Cap to Revenue|NBT Corp - Market Cap to Sales Volume|FBNC: P/S Multiple|SYBT - Price-to-Revenue Coefficient|Market Cap to Revenue DCOM|Bank First National - Price-to-Sales Ratio|P/S Multiple CTBI|BHRB - Price to Sales|Price-to-Revenue Ratio Southside Bancshares SBSI|EQBK: Market Cap to Revenue Ratio|CCNE - Price-to-Revenue Ratio|Price-to-Revenue Coefficient Capital City Bank Group, Inc. CCBG|TRST (TrustCo Bank Corp) - Market Cap to Revenue|HomeTrust Corp - Market Capitalization-to-Revenue Ratio|Market Cap to Revenue Ratio Mid Penn Bancorp (MPB)|FSBC (fivestarbank.com) - Market Cap to Sales Volume|Market Cap to Revenue ORRF (Orrstown Financial Services, Inc.)|NBBK (Needham Bank) - Market Capitalization-to-Revenue Ratio|Price-to-Revenue Ratio First Community Corp FCBC|IBCP: Market Cap to Revenue Ratio|SPFI - Price-to-Revenue Ratio|Price to Sales northpointe.com|Southern Missouri Bancorp, Inc. (SMBC) - Price-to-Revenue Ratio|Heritage Bank of Commerce - Market Capitalization-to-Revenue Ratio|Market Cap to Revenue HIFS|HONE (HarborOne Corp) - Market Cap to Sales Volume|P/S Multiple SHBI|TCBX (tcbssb.com) - Market Capitalization-to-Revenue Ratio|P/S Multiple FMNB (Farmers National Bank)|Bar Harbor Bankshares Inc (BHB) - Price to Sales|UNTY - Price-to-Revenue Ratio|Market Capitalization-to-Revenue Ratio PFIS (Peoples Security Bank & Trust)|Peapack-Gladstone Financial (PGC) - Price-to-Revenue Ratio|Market Cap to Revenue Ratio NFBK|ACNB (ACNB Bank) - P/S Multiple|Market Cap to Revenue Flushing Financial Corporation (FFIC)|Market Cap to Revenue BWB (Bridgewater Bancshares Inc)|BSVN: Price-to-Sales Ratio|Price-to-Revenue Ratio ChoiceOne Financial Services COFS|CARE: Market Cap to Revenue Ratio|Home Bancorp - P/S Multiple|Kearny Financial Corp (KRNY) - Market Cap to Revenue|First Bank Corp (FRBA) - Price-to-Revenue Ratio|CWBC (Community West Bank) - Price-to-Revenue Ratio|Price-to-Revenue Ratio Civista Bancshares|Price to Sales thebankofgreenecounty.com GCBC|P/S Multiple BMRC|Market Cap to Revenue Blue Ridge Bankshares Inc BRBS|P/S Multiple PDLB (Ponce Financial Group Inc)|P/S Multiple Farmers & Merchants Corp FMAO|OBT - Price-to-Revenue Ratio|WTBA: Price-to-Revenue Ratio|PBFS (Pioneer Bancorp) - Market Cap to Revenue|BayCom Corp. - Market Capitalization-to-Revenue Ratio|AVBC (Avidia Bancorp Corp) - P/S Multiple|Price-to-Revenue Ratio FSBW|P/S Multiple PCB|P/S Multiple colony.bank (CBAN)|Price-to-Revenue Ratio Plumas Bank PLBC|FNLC: Market Cap to Revenue Ratio|NECB - Price-to-Revenue Ratio|JMSB - P/S Multiple|timberlandbank.com (TSBK) - Price-to-Revenue Ratio|WSBF - Price-to-Revenue Coefficient|LNKB (LINKBANK) - P/S Multiple|Market Cap to Revenue Parke Bancorp (PKBK)|P/S Multiple FDBC|Price-to-Revenue Coefficient Middlefield Bank Corp|Chemung Financial Corp. - Market Cap to Revenue|Market Cap to Sales Volume WNEB (westfieldbank.com)|Wayne Bank - P/S Multiple|Price-to-Revenue Coefficient FVCBankcorp FVCB|FBLA (FB Bancorp Inc) - Market Cap to Revenue|Price-to-Sales Ratio OVLY (Oak Valley Bancorp.)|PVBC (Provident Bancorp, Inc.) - P/S Multiple|Price to Sales LCNB Corporation LCNB|Price-to-Revenue Ratio First Community (FCCO)|thebankofprinceton.com - Market Cap to Revenue Ratio|Price-to-Revenue Ratio Hawthorn Bancshares, Inc. HWBK|Price-to-Revenue Coefficient Farmers and Merchants Trust Company (FRAF)|VABK: Market Cap to Revenue|Market Capitalization-to-Revenue Ratio OPBK (OP Bancorp)|Market Cap to Revenue Ratio fbvirginia.com|CBNA: Market Cap to Sales Volume|Market Cap to Revenue EFSI|BLFY: Market Capitalization-to-Revenue Ratio|Price-to-Revenue Ratio First Savings Financial (FSFG)|amesnational.com - Market Cap to Revenue Ratio|Price-to-Revenue Ratio Peoples Bancorp PEBK|CB Financial Services Inc. (CBFV) - Price to Sales|BVFL - Price-to-Revenue Ratio|Market Capitalization-to-Revenue Ratio UBFO (United Security Bancshares)|MNSB (MainStreet Bancshares) - Market Cap to Revenue|HNVR: Market Cap to Sales Volume|CZWI (Citizens Community Bancorp, Inc.) - P/S Multiple|CFBK: Market Capitalization-to-Revenue Ratio|P/S Multiple RMBI|FCAP - Price to Sales|Price-to-Revenue Ratio BCB Bancorp, Inc. BCBP|Market Capitalization-to-Revenue Ratio ECBK|EBMT - Price-to-Revenue Ratio|FNWD (Finward Bancorp) - Market Cap to Revenue Ratio|RBKB: P/S Multiple|Market Cap to Revenue SB Financial Group, Inc.|Market Cap to Revenue AFBI|First Guaranty Bancshares Inc. - Price-to-Sales Ratio|Price-to-Revenue Ratio SR Bancorp, Inc. (SRBK)|bogotasavingsbank.com - Market Cap to Revenue Ratio|P/S Multiple UNB (Union Bankshares)|SFBC - Market Cap to Revenue|MGYR - Price-to-Revenue Ratio|RVSB: Price-to-Revenue Ratio|Lake Shore Savings Bank (LSBK) - Price-to-Revenue Ratio|Price to Sales Pathfinder Bank (PBHC)|CFSB (CFSB Bancorp) - P/S Multiple|Market Cap to Revenue Auburn National Bank (AUBN)|P/S Multiple IROQ|P/S Multiple unitedbancorp.com (UBCP)|Price-to-Revenue Ratio Summit State Bank, Inc. SSBI|Fifth District Bank - Price-to-Revenue Ratio|FUSB: Market Cap to Revenue|Market Capitalization-to-Revenue Ratio BOTJ (Bank of the James)|CPBI: P/S Multiple|BYFC (broadwayfederalbank.com) - Price-to-Revenue Ratio|NSTS (North Shore Trust and Savings) - P/S Multiple|P/S Multiple Catalyst Bancorp Inc.|Price-to-Revenue Ratio First Seacoast Bancorp (FSEA)|AmeriServ Financial Corp - Market Cap to Revenue Ratio|Price-to-Revenue Ratio PB Bankshares Inc PBBK|P/S Multiple optimumbank.com OPHC|TCBS - Price-to-Revenue Ratio|Price-to-Revenue Coefficient Home Federal Bancorp, Inc. HFBL|BAFN: P/S Multiple|Market Cap to Revenue Marathon Bank|KFFB (Kentucky First Federal Bancorp) - P/S Multiple|Glen Burnie Bank (GLBZ) - Price-to-Revenue Coefficient|Market Cap to Revenue CARV (Carver Bancorp, Inc.)|Market Cap to Sales Volume BRKL|P/S Multiple EBTC (Enterprise Bank)|Price-to-Revenue Coefficient ESSA Bank & Trust (ESSA)|EVBN: Market Cap to Revenue|Price-to-Sales Ratio FBMS|FLIC: P/S Multiple|Price to Sales HMN Financial (HMNF)|Price-to-Revenue Ratio HomeTrust Bancshares, Inc.|Market Cap to Revenue Ratio IBTX (Independent Bank Group Inc.)|Price-to-Revenue Ratio Macatawa Bank (MCBC)|Price-to-Revenue Coefficient oldpoint.com|Penns Woods Bancorp, Inc. - Market Cap to Revenue|Market Capitalization-to-Revenue Ratio SASR|Territorial Savings Bank (TBNK) - Market Cap to Revenue Ratio|Village Bank & Trust - Market Cap to Sales Volume|WMPN (William Penn Bank) - Market Cap to Revenue|1895bancorpofwisconsin.com - Market Capitalization-to-Revenue Ratio|Price-to-Revenue Ratio Southern States Bank