Symbotic Automation - SYM Revenue Change YoY (Last 12 Months)

Tracking the revenue trend over four quarters year-over-year on GURU.Markets, we note that the 20.00 mark captures this metric. Symbotic Inc. (SYM) operates a moderately cyclical business, as large-scale contracts offset potential reductions in retail investment. Symbotic Inc. (SYM) deploys AI robots to optimize B2B sector warehouses. High investor confidence and its status as a technological leader create a powerful positive backdrop for the shares.

Symbotic Inc (SYM) - metric breakdowns and financial figures
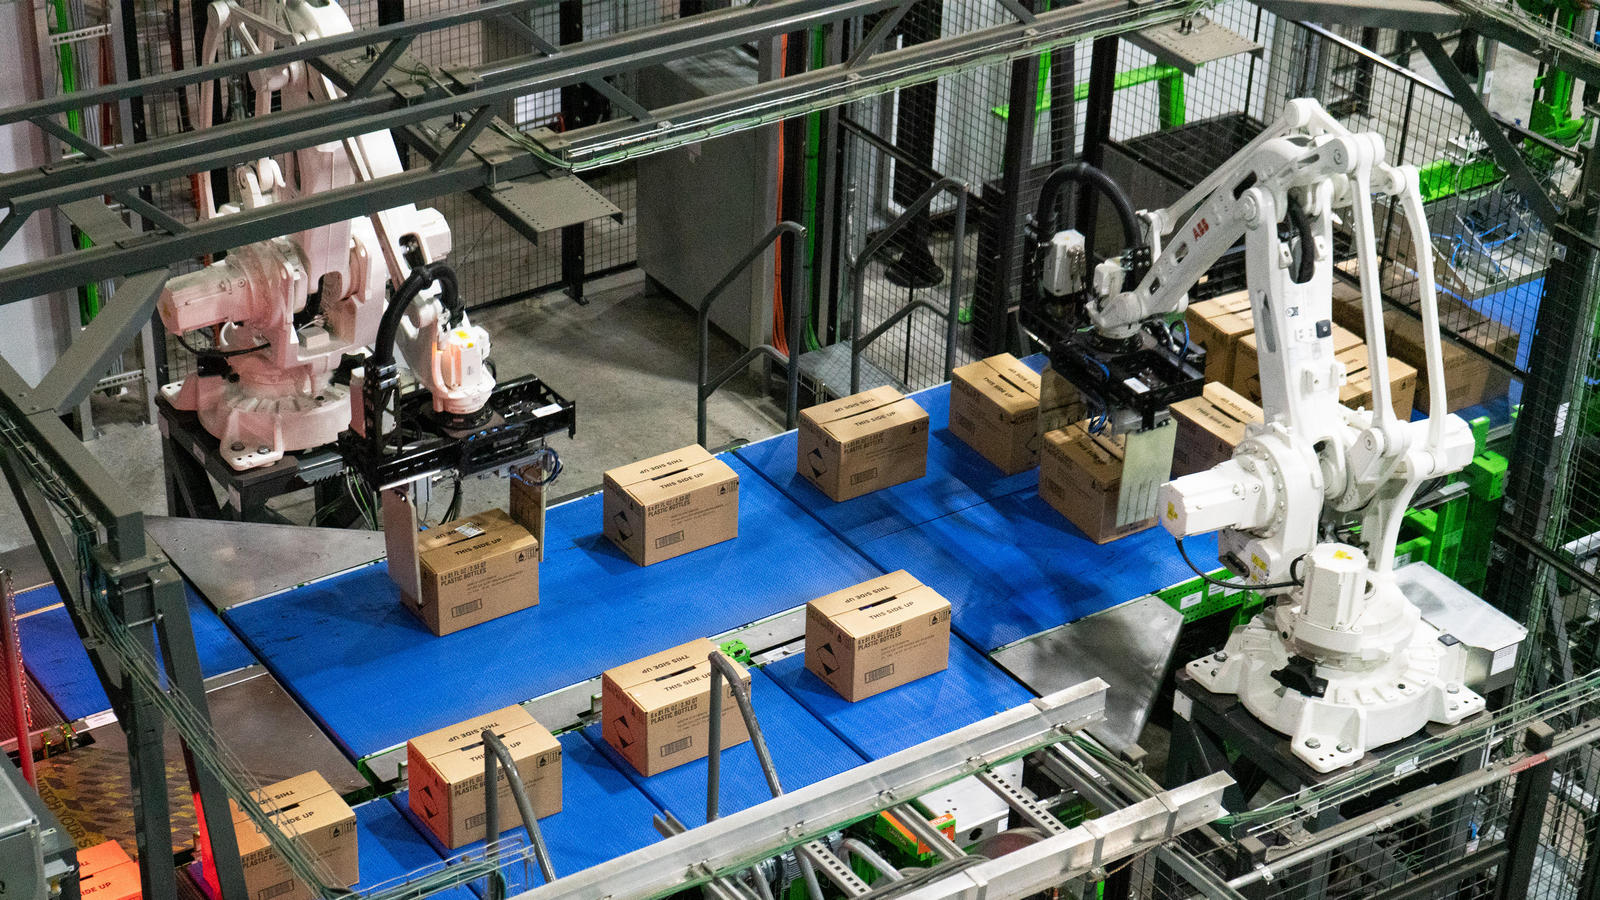
For Symbotic Inc., which focuses on AI integration of warehouse robotics while outsourcing production, the year-over-year revenue change over the trailing twelve months (TTM) serves as an indicator of the scalability of its intellectual model. This metric calculates the dynamics of the rolling annual turnover, neutralizing seasonality and allowing investors to distinguish sustainable commercial growth from short-term spikes, thereby confirming the business viability amidst its dependence on external factories.
