TFII - TFI International Inc Market Cap to Sales Volume

Brandmark of TFI International Inc (TFII)

TFI International Inc. (TFII) is scaling its operations through aggressive acquisitions and digital asset optimization. Dominance across routes allows the operator to maintain strict pricing power. The revenue multiple reflects the business value dynamics, where the 0.90 mark serves as a key metric. The Canadian behemoth continues its expansion into the US, evolving into a powerful transport sector consolidator through the systematic integration of new companies.

TFI International (TFII) - P/S Multiple from 07/04/2022 to 11/13/2026

Analytical breakdowns for TransForce (TFII)
- share price and consensus valuation forecast:
- market capitalization statistics:
Fundamental company analysis:tfiintl.com (TFII)
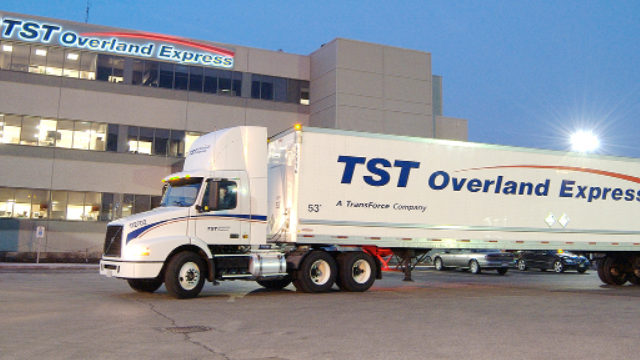
Finished products of TFI International Inc.

The P/S multiple determines the market value of TFI International Inc. (TFII) relative to its generated revenue, allowing investors to assess the fairness of the business capitalization regardless of current earnings. By analyzing the P/S trend against the backdrop of a stabilizing North American trucking market and the diversification of the client base, one can judge the fundamental stability of the company's logistics model and the potential for share price growth.

Who TFI International Inc. competes with

UNP (up.com) - Market Capitalization-to-Revenue Ratio|Prologis - Market Cap to Revenue|Market Cap to Sales Volume CP (Canadian Pacific)|Norfolk Southern Railway - P/S Multiple|Price-to-Sales Ratio CSX|CNI: P/S Multiple|PCAR - Price-to-Revenue Coefficient|Market Cap to Revenue PSA|CHRW: Market Capitalization-to-Revenue Ratio|P/S Multiple XPO|Price-to-Revenue Coefficient U-Haul International|Price-to-Revenue Ratio Saia, Inc. SAIA|R: Market Cap to Revenue Ratio|KNX: Market Cap to Revenue|GATX Corporation - Market Cap to Sales Volume|LSTR: P/S Multiple|Price to Sales Schneider Logistics (SNDR)|Price-to-Revenue Ratio RXO Corp|TRN: Market Capitalization-to-Revenue Ratio|Price-to-Revenue Ratio werner.com (WERN)|Distribution Solutions Group - Market Cap to Revenue Ratio|P/S Multiple SCSC (ScanSource Corp)|P/S Multiple Heartland Express Inc. HTLD|HY: Market Cap to Revenue|universallogistics.com - Market Cap to Sales Volume|CVLG: P/S Multiple|WNC - Price-to-Revenue Coefficient|Price-to-Revenue Ratio Owens & Minor Corp|Price to Sales Radiant RLGT|Price-to-Revenue Ratio P.A.M. Transportation Services, Inc. (PAMT)|proficientautologistics.com - Market Cap to Revenue Ratio|P/S Multiple RAIL (FreightCar America, Inc.)|P/S Multiple MingZhu Logistics Holdings Limited YGMZ|ELOG - Price-to-Revenue Ratio|HXHX: Price-to-Revenue Ratio|ATXG (addentax.com) - Market Cap to Revenue|Cheetah Net Supply Chain Corp. - Market Capitalization-to-Revenue Ratio|EZFL (EZFill Holdings) - P/S Multiple|Nikola Motor (NKLA) - Price-to-Revenue Coefficient|Price-to-Revenue Ratio PAM Transportation (PTSI)|Daseke Corporation - Market Cap to Revenue Ratio