VEV vicinitymotorcorp.com Quarterly EPS earnings growth

The stability of Vicinity Motor Corp. (VEV) assets relies on the seamless delivery of batteries and components to plants in Canada and the US. The quarterly EPS growth marker visualizes profit dynamics, where the 0.00 indicator reflects the profitability status. Management aims to expand its presence in the municipal electric bus niche, although investors remain cautious due to the complexities of scaling production.

Vicinity Motor Corp. - analytical breakdowns and key metrics (VEV)
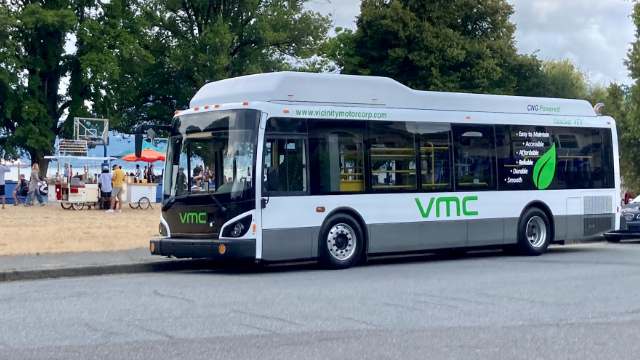
Analyzing the ability of Vicinity Motor Corp. (VEV) to withstand the expansion of automotive behemoths in the electric bus market requires monitoring real operational efficiency. The quarterly EPS growth vector captures net income per share dynamics, allowing for the immediate detection of a business recovery impulse prior to the publication of financial statements. However, mistaking a short-term rally for a sustainable trend without a balance sheet audit risks a capital freeze.
