Vicinity Motor Corp (VEV): Net earnings per share (EPS TTM)

The high barrier to entry is driven by the capital intensity of plants and stringent regulation in the US and Canada, while government subsidies and municipal contracts provide a robust moat for the business. Vicinity Motor Corp. (VEV) shows a 12-month unit profit trend where -0.39 serves as the base parameter value. However, a shortage of technologists and high staff turnover in electric bus assembly are placing significant strain on human capital.

Metric breakdowns and analytics for Vicinity Motor Corp (VEV)
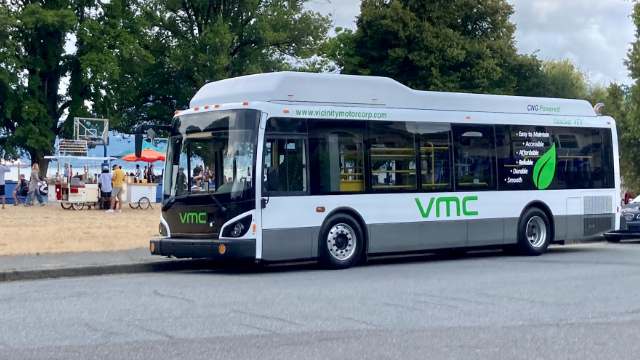
Vicinity Motor Corp. is scaling the production of electric buses to decarbonize transportation in North America. The TTM net income per share trend reflects the actual efficiency of resource allocation among all security holders. This indicator measures the business's ability to maintain margins amid rising component costs. A stable range of values confirms the resilience of the business model, while sharp deviations on the chart signal a critical decline in return on equity.
