Vicinity Motor Corp (VEV) Price to Earnings Ratio

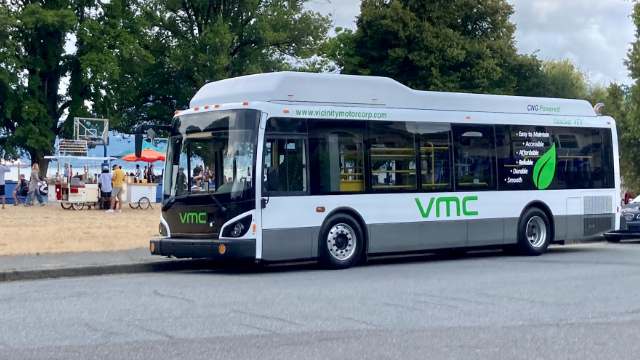
Demand for Vicinity Motor Corp. (VEV) electric buses fluctuates according to the budget cycles of cities and firms, although the global transition toward ecology supports orders. Assembly in Canada and the US relies on a stable influx of batteries and components. This price chart visualizing trading dynamics with the -0.10 indicator demonstrates a situation where patent protection and subsidies are weakening due to logistical disruptions and capital shortages.

Comprehensive metric breakdowns and analytics for Vicinity Motor Corp (VEV)
The market assesses the investment potential of Vicinity Motor Corp. (VEV) through the lens of high volatility. The P/E ratio compares the market value of the share with actual earnings, determining the investment payback period. By analyzing changes in the company's P/E value, an investor can identify the business's margin of safety. For Vicinity Motor Corp. (VEV), this indicator is critical due to capital shortages and production risks associated with electric buses. The asset is categorized as a high-risk speculative security.
