SND - רווח תפעולי EBITDA smartsand.com

Smart Sand, Inc. margins depend on drilling activity and rail freight costs. This EBITDA_Co chart clearly demonstrates the business's ability to scale profits, while the 38.03 mark reflects the latest data. The company achieves cost optimization through the outsourcing of IT systems and logistics. Proppant deliveries and terminal operations provide a stable income stream, creating potential for international growth.

פילוחי נתונים אנליטיים מרוכזים עבור Smart Sand (SND)
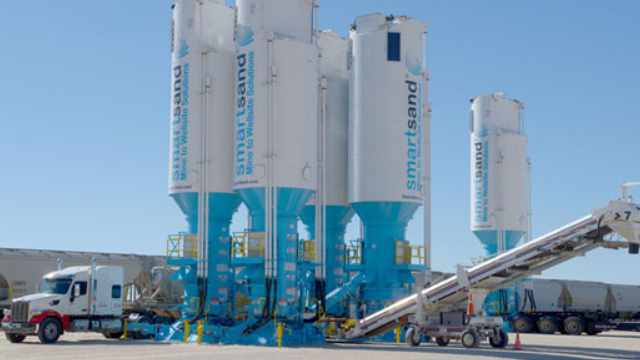
This metric measures the actual cash flow from core operations before deducting depreciation and borrowing costs, allowing for an assessment of the business's resilience to cost-push inflation. By analyzing the EBITDA timeline, an investor can see how the rising demand for hydraulic fracturing in the US, amid global commodity shifts, converts into operating income for Smart Sand, Inc. (SND), minimizing the risks of capital drawdown.
