SND (Smart Sand Inc) מכפיל P/E עתידי

The forward P/E ratio of Smart Sand, Inc. (SND) on the GURU.Markets chart illustrates the valuation trend, where the 0.00 mark captures this metric. The proppant market is cyclical and prone to oversupply, which intensifies competition driven by logistics. Equipment wear and tear and the volatility of shale drilling constrain the margins of Smart Sand, Inc. (SND). Profitability is based on hydraulic fracturing volumes and rail expenses.

פילוחי מדדים פיננסיים ומדדי שוק עבור Smart Sand Corp (SND)
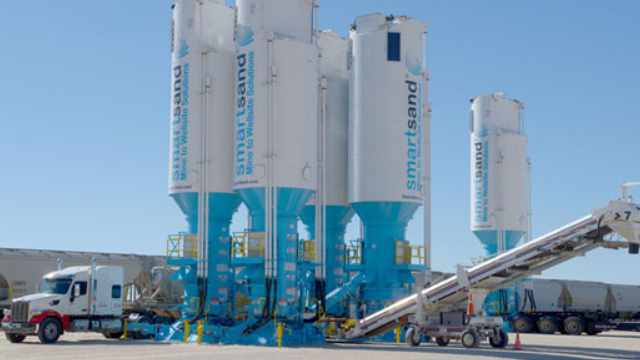
Smart Sand, Inc. (SND) provides the US oil and gas sector with critical frac sand, benefiting from the redistribution of global commodity flows amid global instability. A P/E-based forecast valuation analysis allows for a comparison of the current share price with expected earnings, where a flat line signals either hidden undervaluation of the asset or the risk of capital stagnation in the absence of market demand.
