SND: יחס מחיר לצמיחת רווח נקי Smart Sand Inc

The PEG ratio on the precise GURU.Markets chart demonstrates how global upheavals in Eurasia are stimulating demand for Smart Sand, Inc. (SND) sand, with the 0.00 mark recording this metric. While domestic shale production in the US is increasing orders, logistics costs and the commodity status of the product limit the company's pricing power.

פילוחים אנליטיים של חברת Smart Sand, Inc. (SND)
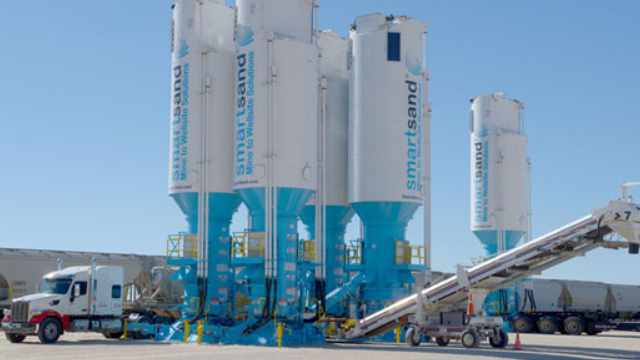
The PEG ratio relates the P/E market multiple to the net income growth rate, where a value below one signals that an asset is undervalued relative to its expansion. By analyzing the dynamics of the PEG undervaluation indicator, an investor determines the potential for price growth. This is critical for Smart Sand, Inc. (SND), as demand for proppant during hydraulic fracturing directly impacts scaling rates. The metric reveals the balance between the share price and the efficiency of sand deliveries to the oil and gas sector.
