Ameresco Corp (AMRC) - Market Cap to Earnings

Ameresco Inc - graphic logo of issuer AMRC

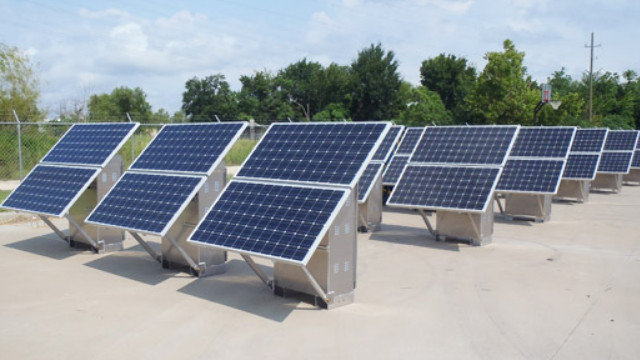
This daily price chart of the price-to-earnings ratio for Ameresco, Inc. (AMRC) in the GURU.Markets terminal allows for an assessment of risks associated with dependence on government contracts and interest rates. The business relies on designing energy efficiency systems for municipalities and schools. The implementation of building modernizations and solar power plants currently generates the primary effect, while the 21.20 mark indicates the current valuation of the asset relative to its earnings.

Ameresco Corp - AMRC P/E Multiple (period 07/04/2022 - 11/14/2026)

Comprehensive metric breakdowns and analytics for Ameresco Corp (AMRC)
- market capitalization indicators:
General company analysis:AMRC (ameresco.com)
Flagship merchandise of Ameresco Corp

Demand for energy independence in the US and Europe amid geopolitical tensions is influencing the current P/E multiple, reflecting market expectations for Ameresco, Inc. (AMRC) projects. This ratio correlates the market value of the share with net income, measuring capital density and determining how much an investor pays per unit of earnings, which allows for the identification of asset overvaluation or hidden fundamental vulnerabilities.

Key competitors

FSLR: Company Value to Net Income|P/E Multiple BE|BEP - Market Cap to Earnings|Price to Earnings Ratio Brookfield Renewable Corporation BEPC|ORA: Price to Earnings Multiple|Clearway Energy, Inc. - P/E Multiple|Market Cap to Earnings sunrun.com|Enlight (ENLT) - Price to Earnings Ratio|ReNew Energy Global plc - Company Value to Net Income|PLUG (Plug Power Corp) - P/E Multiple|SEDG - Market Cap to Net Income Ratio|Price to Earnings Ratio XIFR (XPLR Infrastructure LP)|JKS - Market Cap to Earnings|P/E Multiple CSIQ (Canadian Solar)|P/E Multiple Clean Energy Fuels Corp CLNE|GEVO - Price to Earnings Ratio|NET Power Energy (NPWR) - Price to Earnings Ratio|OPAL: P/E Multiple|Market Cap to Earnings Montana Technologies Corporation (AIRJ)|Price to Earnings Ratio Montauk Renewables Inc.|TE: Company Value to Net Income|P/E Multiple FCEL|ELLO - Market Cap to Earnings|Price to Earnings Ratio XCF Global SAFX|Business Payback Period stem.com (STEM)|Aemetis Corp - P/E Multiple|Verde Clean Fuels, Inc. (VGAS) - Price to Earnings Ratio|us.sunpower.com (SPWR) - Price to Earnings Ratio|Market Cap to Earnings Turbo Energy (TURB)|Price to Earnings Ratio ENGS|SOL: Company Value to Net Income|P/E Multiple OPTT|Business Payback Period Zeo Energy Corp|Price to Earnings Ratio Maxeon MAXN|SUUN: Price to Earnings Multiple|SolarMax - P/E Multiple|Eco Wave Power Global AB (WAVE) - Price to Earnings Ratio|VVPR (VivoPower) - Price to Earnings Ratio|SPRU - Business Payback Period|SLNH (Soluna) - P/E Multiple|P/E Multiple Skycorp Solar Group Ltd.|Price to Earnings Ratio Founder Group Limited (FGL)|Price to Earnings Ratio cetyinc.com CETY|Price to Earnings Ratio Advent Technologies Holdings ADN|Company Value to Net Income HTOO|Ascent Solar - P/E Multiple|SUNation Solar (SUNE) - Price to Earnings Ratio|LGN: P/E Multiple|Market Cap to Net Income Ratio Alternus Clean Energy, Inc. ALCE|Price to Earnings Ratio Altus Power Inc|CSLR: Company Value to Net Income|P/E Multiple EVA|NOVA - Market Cap to Earnings|P/E Multiple PEGY (Pineapple Energy Inc.)|singlepoint.com (SING) - Market Cap to Earnings|SPI - Price to Earnings Ratio|VSTE (Vast Renewables Limited) - Price to Earnings Multiple|VTNR (vertexenergy.com) - Price to Earnings Ratio