XCF Global (SAFX) - Market Cap to Earnings

XCF Global - graphic logo of issuer SAFX

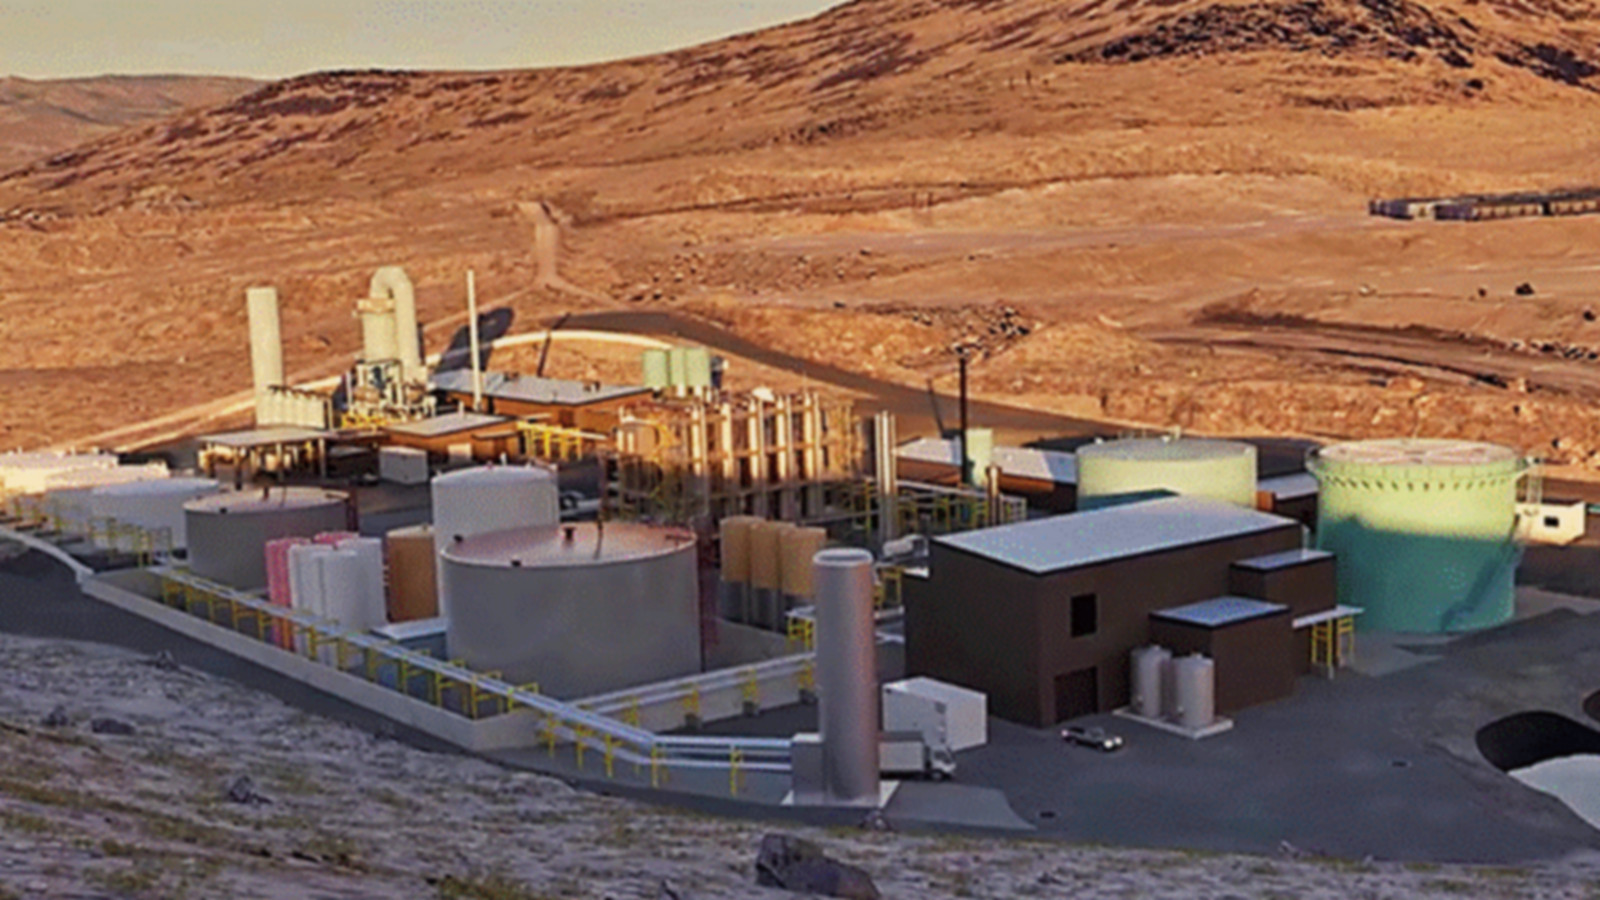
The price action of XCF Global Inc (SAFX) reflects the value of -0.50. Currently, production facilities for sustainable aviation fuel are undergoing the equipment launch and calibration phase. Financial stability is based on government support and long-term agreements with carriers. Business growth depends on the stringency of environmental regulations, the volume of subsidies, and a steady inflow of organic feedstock for aviation decarbonization.

XCF Global Capital - SAFX P/E Multiple (period 06/10/2025 - 11/13/2026)
Flagship merchandise of XCF Global Inc.

For XCF Global Inc (SAFX), the P/E ratio reflects the market value of the business relative to its net income. This metric is calculated as the ratio of the current share price to the annual earnings per share, measuring the extent to which an investor is overpaying for the asset. When analyzing the company's P/E history, it is critical to consider the dependence of earnings on US environmental subsidies. The high capital intensity of SAF plants makes price stability sensitive to any changes in EPA fiscal policy.

Competing companies

FSLR: Company Value to Net Income|P/E Multiple BE|BEP - Market Cap to Earnings|Price to Earnings Ratio Brookfield Renewable Corporation BEPC|ORA: Price to Earnings Multiple|Clearway Energy, Inc. - P/E Multiple|Market Cap to Earnings sunrun.com|Enlight (ENLT) - Price to Earnings Ratio|ReNew Energy Global plc - Company Value to Net Income|PLUG (Plug Power Corp) - P/E Multiple|SEDG - Market Cap to Net Income Ratio|Price to Earnings Ratio XIFR (XPLR Infrastructure LP)|AMRC - Market Cap to Earnings|JinkoSolar Holding Co Ltd - Price to Earnings Ratio|CSIQ: Price to Earnings Multiple|Clean Energy - P/E Multiple|Gevo Biofuels (GEVO) - Price to Earnings Ratio|NPWR: P/E Multiple|Market Cap to Net Income OPAL (opalfuels.com)|Price to Earnings Ratio AIRJ|MNTK: Company Value to Net Income|P/E Multiple TE|FuelCell Energy Corp (FCEL) - Market Cap to Net Income Ratio|Price to Earnings Ratio Ellomay Capital Ltd. ELLO|stem.com - Price to Earnings Ratio|AMTX - Price to Earnings Ratio|Market Cap to Earnings Verde Clean Fuels, Inc.|SPWR: P/E Multiple|TURB (Turbo Energy) - Price to Earnings Ratio|ENGS (Energys Group Ltd) - P/E Multiple|P/E Multiple renesolapower.com|Price to Earnings Ratio Ocean Power Technologies (OPTT)|Price to Earnings Ratio ZEO (Zeo Energy Corp)|Maxeon - Price to Earnings Ratio|Company Value to Net Income SUUN|SolarMax - P/E Multiple|Business Payback Period Eco Wave Power Global AB WAVE|VivoPower (VVPR) - Price to Earnings Ratio|Price to Earnings Multiple SPRU|SLNH (Soluna) - P/E Multiple|Price to Earnings Ratio Skycorp Solar Group Ltd. (PN)|Price to Earnings Ratio Founder Group Limited (FGL)|Business Payback Period cetyinc.com|P/E Multiple ADN (Advent Technologies Holdings)|P/E Multiple Fusion Fuel Green plc HTOO|Ascent Solar - P/E Multiple|Market Cap to Net Income SUNE|LGN (legence.com) - Price to Earnings Ratio|Price to Earnings Multiple ALCE|AMPS (Altus Power Inc) - P/E Multiple|CSLR - Market Cap to Net Income Ratio|Price to Earnings Ratio Enviva Inc. (EVA)|NOVA (Sunnova Energy Corp) - Company Value to Net Income|P/E Multiple PEGY (Pineapple Energy Inc.)|singlepoint.com (SING) - Market Cap to Earnings|SPI Energy Co. Ltd - P/E Multiple|Market Cap to Earnings Vast Renewables Limited|vertexenergy.com (VTNR) - Price to Earnings Ratio