Vast Renewables (VSTE) - Market Cap to Earnings

Vast Renewables - graphic logo of issuer VSTE

The market value of Vast Renewables Limited (VSTE) on the GURU.Markets platform, as illustrated in this chart, where the P/E ratio is -0.20, helps assess the efficiency of the engineers implementing CSP technologies. The business relies on a loyal staff of specialists, yet faces high construction costs and tariff volatility. The enterprise's success is based on the timely procurement of investments and stable access to power grids.

Vast Renewables Ltd - VSTE P/E Multiple (period 02/21/2024 - 06/07/2025)

Comprehensive metric breakdowns and analytics for Vast Renewables Limited (VSTE)
- market capitalization indicators:
General company analysis:VSTE (Vast Energy)
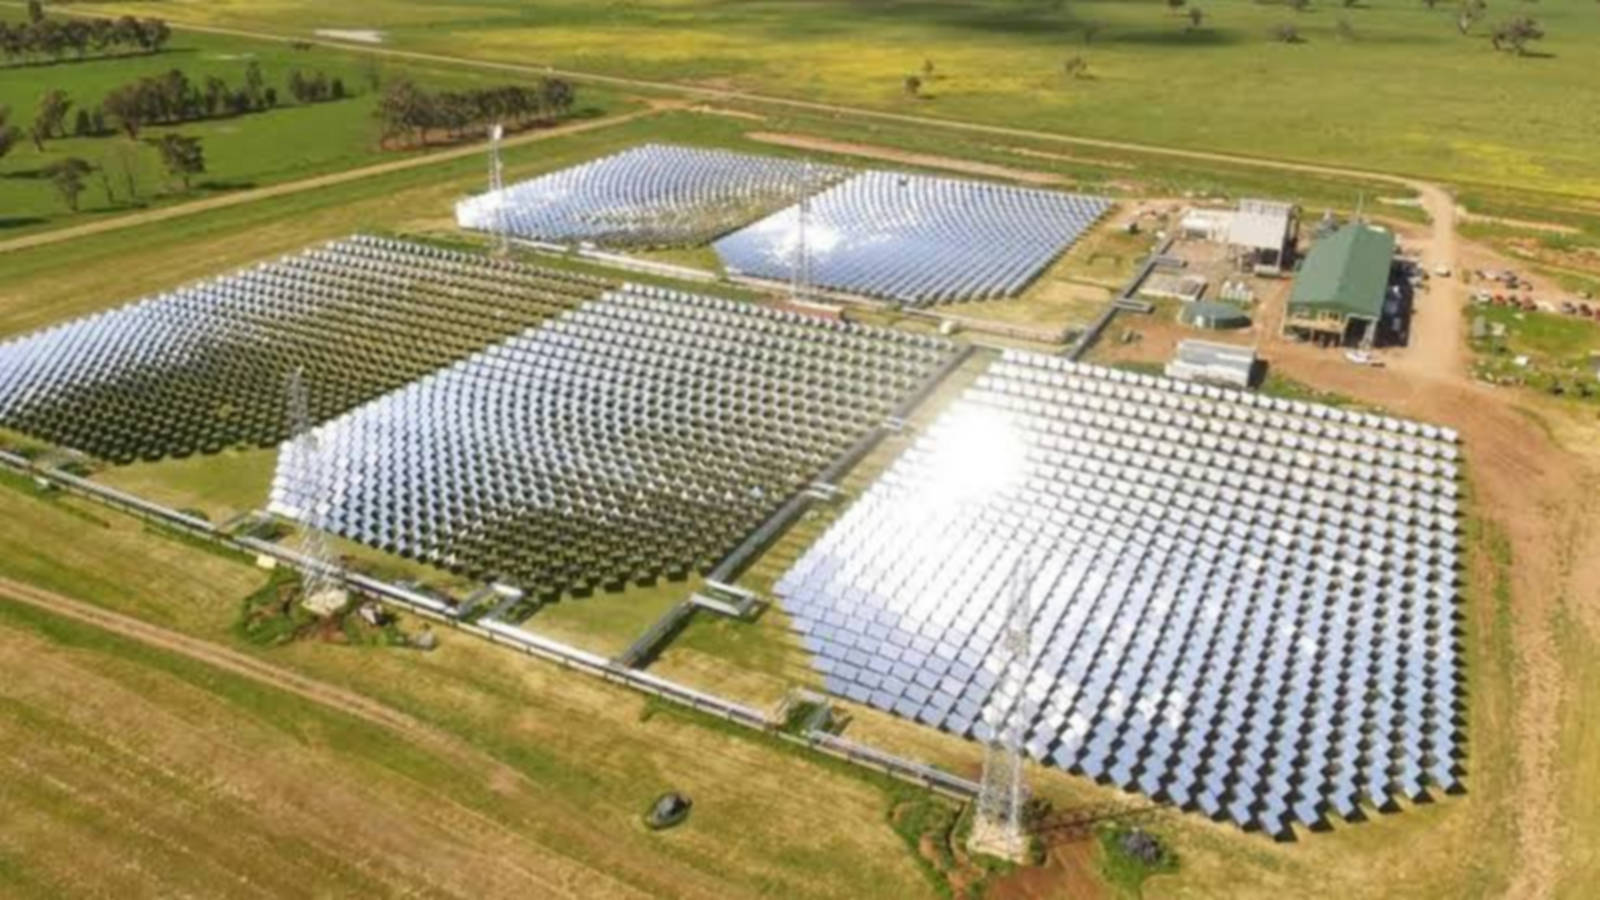
Flagship merchandise of Vast Energy

Vast Renewables Limited (VSTE) occupies a strategic niche in the growing industrial solar energy and electrical storage systems sector. This ratio reflects the investment payback period through the relationship between market capitalization and net income. Investors utilize this balance to determine whether an asset is overvalued relative to its ability to generate cash flow. An analysis of the P/E multiple allows for an assessment of business scaling rates amid expanding utility demand. The P/E multiple trend visualizes either the risk or the opportunity for an undervalued entry into the equity.

Competing companies

FSLR: Company Value to Net Income|P/E Multiple BE|Brookfield Renewable Corp - Price to Earnings Multiple|Price to Earnings Ratio bep.brookfield.com/bepc BEPC|ormat.com (ORA) - Market Cap to Earnings|Clearway Corp - P/E Multiple|Company Value to Net Income RUN (Sunrun)|Enlight Renewable Energy Ltd (ENLT) - Price to Earnings Ratio|Market Cap to Net Income Ratio ReNew Energy Global RNW|PLUG (Plug) - P/E Multiple|SEDG - Market Cap to Net Income Ratio|Price to Earnings Ratio XIFR (XPLR Energy)|AMRC - Market Cap to Earnings|P/E Multiple JKS (JinkoSolar Corp)|CSIQ - Price to Earnings Ratio|CLNE - Price to Earnings Ratio|Market Cap to Earnings Gevo|NPWR (NET Power Inc.) - Price to Earnings Ratio|OPAL Fuels Inc (OPAL) - P/E Multiple|Price to Earnings Ratio AIRJ|MNTK (Montauk Renewables) - Market Price to Net Income Ratio|t1energy.com (TE) - Company Value to Net Income|Price to Earnings Ratio FuelCell Energy, Inc. FCEL|P/E Multiple ELLO (ellomay.com)|XCF Global Inc - Price to Earnings Ratio|STEM - Price to Earnings Ratio|Business Payback Period Aemetis Inc. AMTX|Verde Clean Fuels Inc. (VGAS) - Price to Earnings Ratio|SunPower Corporation - Company Value to Net Income|TURB (Turbo Energy S.A.) - P/E Multiple|ENGS - Market Cap to Net Income Ratio|Price to Earnings Ratio SOL (Emeren Group)|OPTT - Market Cap to Earnings|P/E Multiple ZEO (gosunergy.com)|P/E Multiple maxeon.com MAXN|SUUN - Price to Earnings Ratio|solarmaxtech.com (SMXT) - Price to Earnings Ratio|WAVE: P/E Multiple|VVPR: Market Price to Net Income Ratio|Price to Earnings Ratio Spruce Power Holding Corp|SLNH - Market Cap to Net Income Ratio|Price to Earnings Ratio Skycorp Solar Group Ltd. (PN)|Business Payback Period Founder Group Ltd|P/E Multiple CETY (Clean Energy Technologies)|Business Payback Period Advent Technologies Holdings Inc. (ADN)|HTOO - Price to Earnings Ratio|Company Value to Net Income ASTI (Ascent Solar Technologies, Inc.)|SUNation (SUNE) - Price to Earnings Ratio|Market Cap to Earnings Legence Corp. (LGN)|Price to Earnings Ratio alternusenergy.com|altuspower.com - Market Cap to Net Income|P/E Multiple CSLR|EVA - Market Cap to Earnings|Price to Earnings Ratio Sunnova Energy International Inc. NOVA|Business Payback Period Pineapple Energy Inc (PEGY)|SING - Price to Earnings Ratio|Market Cap to Net Income Ratio SPI Energy (SPI)|VTNR: P/E Multiple