SolarMax Technology, Inc. (SMXT) - Market Cap to Earnings

SolarMax Technology, Inc. - graphic logo of issuer SMXT

SolarMax Technology (SMXT) provides solar panel installations in the US and China, generating profit upon project launch with minimal expenditures. This daily price chart illustrates the price action of an asset with a multiplier of -2.40. The company's growth relies on government decarbonization support and private demand for LED systems. Meanwhile, the business avoids mergers due to loans, focusing instead on local engineering tasks and alliances with vendors.

SolarMax Technology Inc. - SMXT P/E Multiple (period 02/28/2024 - 11/10/2026)
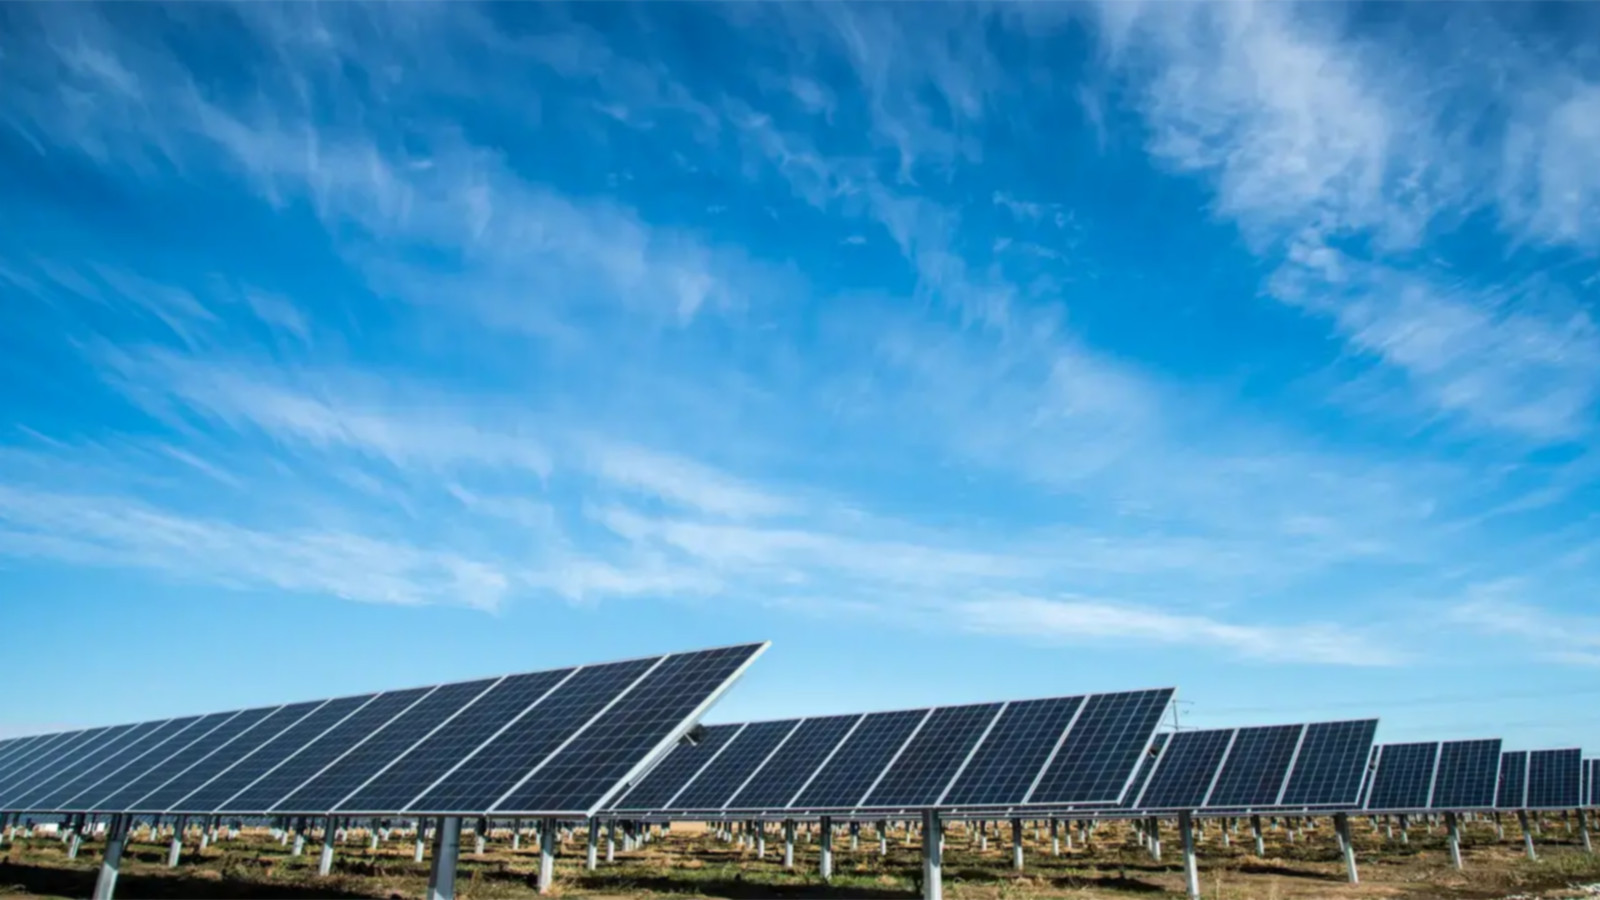
Flagship merchandise of SolarMax

SolarMax Technology's reputation as a stable California-based solar system installer ensures predictable cash flows for the business. By analyzing the company's historical P/E, an investor assesses the market value of a single unit of net profit, which makes it possible to determine the extent of the asset's overvaluation or identify the business's undervaluation relative to its ability to generate real income.

Analysis of competing companies

FSLR: Company Value to Net Income|P/E Multiple BE|BEP - Market Cap to Earnings|Price to Earnings Ratio Brookfield Renewable Corporation BEPC|ORA: Price to Earnings Multiple|Clearway Energy, Inc. - P/E Multiple|Market Cap to Earnings sunrun.com|Enlight (ENLT) - Price to Earnings Ratio|ReNew Energy Global plc - Company Value to Net Income|PLUG (Plug Power Corp) - P/E Multiple|SEDG - Market Cap to Net Income Ratio|Price to Earnings Ratio XIFR (XPLR Infrastructure LP)|AMRC - Market Cap to Earnings|Price to Earnings Ratio JinkoSolar Holding Co Ltd JKS|Business Payback Period Canadian Solar Inc (CSIQ)|CLNE - Price to Earnings Ratio|Market Cap to Earnings Gevo Biofuels|NET Power Inc. (NPWR) - Price to Earnings Ratio|OPAL (opalfuels.com) - Price to Earnings Ratio|AIRJ (Montana Technologies Corp) - P/E Multiple|P/E Multiple Montauk Energy|Price to Earnings Ratio T1 Energy Inc (TE)|FCEL (FuelCell Energy Corp) - Company Value to Net Income|Price to Earnings Ratio Ellomay Capital Ltd. ELLO|SAFX - Price to Earnings Ratio|Stem - P/E Multiple|AMTX - P/E Multiple|VGAS (verdecleanfuels.com) - Price to Earnings Ratio|Price to Earnings Multiple SPWR|Price to Earnings Ratio TURB|ENGS: Company Value to Net Income|Price to Earnings Ratio SOL (Emeren)|Market Price to Net Income Ratio OPTT|P/E Multiple ZEO (Sunergy)|Maxeon Solar Technologies Ltd. (MAXN) - Market Cap to Earnings|SolarBank Corp. - P/E Multiple|Eco Wave Power Global AB (WAVE) - Price to Earnings Ratio|VVPR: P/E Multiple|Spruce Power Holding Corporation - Company Value to Net Income|Price to Earnings Ratio Soluna|Price to Earnings Multiple PN (Skycorp Solar Group Ltd.)|Price to Earnings Ratio Founder Group Limited (FGL)|CETY - Market Cap to Earnings|Price to Earnings Ratio Advent Technologies Holdings ADN|Fusion Fuel Green plc - Price to Earnings Ratio|ASTI - Price to Earnings Ratio|Market Cap to Earnings SUNation Solar|LGN: P/E Multiple|Market Cap to Net Income Ratio Alternus Clean Energy, Inc. ALCE|Price to Earnings Ratio AMPS|Market Cap to Earnings Complete Solaria Inc. CSLR|Price to Earnings Ratio Enviva Inc. (EVA)|Business Payback Period Sunnova Energy Corp|Price to Earnings Ratio Pineapple Energy Inc. PEGY|SING - Price to Earnings Ratio|SPI: Price to Earnings Ratio|VSTE (Vast Renewables Limited) - Price to Earnings Multiple|VTNR (vertexenergy.com) - Price to Earnings Ratio