Avinger Inc (AVGR) - Market Cap to Earnings

Corporate emblem and logo of Avinger Inc. (AVGR)

The Avinger, Inc. (AVGR) price chart on the GURU.Markets platform illustrates the price action of an asset whose market niche is characterized by a slow demand refresh rate and limited cash flow, necessitating technological updates. The current indicator stands at -0.10. The business relies on the development of unique OCT-guided catheters, while sales success depends on insurance reimbursements and physician adoption of these methods.

Avinger Inc (AVGR): Price to Earnings Ratio from 07/04/2022 to 02/22/2025

Comprehensive metric breakdowns and analytics for Avinger, Inc (AVGR)
- stock price and consensus target price:
General company analysis:avinger.com - AVGR
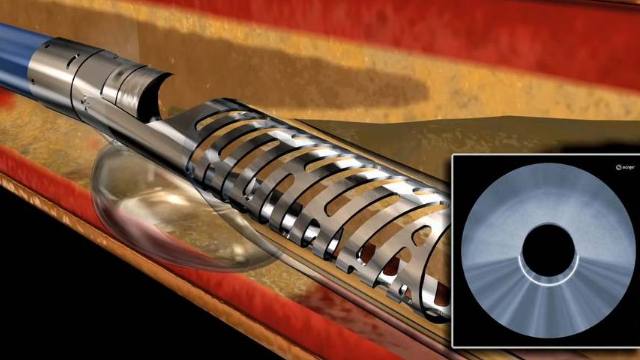
Manufactured product of Avinger, Inc.

Analyzing the market status of Avinger, Inc. (AVGR) through the price-to-earnings ratio allows for an assessment of the issuer's investment attractiveness. This metric compares the current share price with net income to determine the capital payback period. The coefficient's sensitivity depends on the balance between speculative expectations and actual profits. For Avinger, Inc. (AVGR), this calculation confirms the efficiency of its California-based precision catheter production. Product quality control directly impacts the fundamental stability of the stock price.

Analysis of competing companies

dexcom.com - Market Cap to Net Income|P/E Multiple PEN|NOVT - Market Cap to Earnings|Haemonetics Corp. - Price to Earnings Ratio|P/E Multiple Inspire Medical Systems Inc INSP|PRCT: Price to Earnings Ratio|conmed.com - Market Price to Net Income Ratio|PLSE: P/E Multiple|INMD - Business Payback Period|PMI (Picard Medical Inc.) - P/E Multiple|Price to Earnings Ratio Surmodics Inc. (SRDX)|Price to Earnings Ratio SENS (Senseonics)|NPCE (neuropace.com) - Company Value to Net Income|Price to Earnings Ratio Tactile Medical TCMD|SNWV - Price to Earnings Ratio|Outset - P/E Multiple|Market Cap to Earnings Electromed, Inc.|LNSR: P/E Multiple|Price to Earnings Multiple RCEL|PROF (Profound Medical Corp) - P/E Multiple|Baird Medical Corp (BDMD) - Business Payback Period|P/E Multiple EDAP|Price to Earnings Ratio apyxmedical.com APYX|P/E Multiple ICCM (IceCure Medical)|P/E Multiple Pulmonx Corp LUNG|TELA - Price to Earnings Ratio|CTSO: Price to Earnings Ratio|SRTS (Sensus Healthcare Corp) - Price to Earnings Ratio|Zynex Corp - Company Value to Net Income|ECOR (electroCore Inc) - P/E Multiple|Market Cap to Earnings Vicarious Surgical Corp RBOT|Price to Earnings Ratio Inspira Technologies Oxy (IINN)|SeaStar Medical Holding Corporation (ICU) - Market Cap to Net Income Ratio|IRIDEX - Price to Earnings Ratio|P/E Multiple Intelligent Bio Solutions Inc INBS|AINostix - P/E Multiple|Business Payback Period profusa.com PFSA|strataskinsciences.com (SSKN) - Price to Earnings Ratio|Market Cap to Net Income GCTK (glucotrack.com)|Price to Earnings Ratio NanoVibronix|Price to Earnings Ratio Venus Concept Corporation (VERO)|P/E Multiple NUWE|AEMD - Market Cap to Earnings|Price to Earnings Ratio Asensus Surgical ASXC|BSGM: Price to Earnings Multiple|CUTR: Price to Earnings Ratio|Know Labs Corporation - Market Price to Net Income Ratio|NARI: P/E Multiple|nevro.com (NVRO) - P/E Multiple|Price to Earnings Ratio RSLS|Price to Earnings Ratio SILK