Silk Road Medical Inc (SILK) - Market Cap to Earnings
Corporate emblem and logo of Silk Road Medical, Inc. (SILK)

This daily price chart for Silk Road Medical, Inc (SILK) illustrates the multiplier dynamics, which currently stand at -20.00. The business delegates electronics production to external CDMO centers to focus on software development. The model relies on sourcing filters and catheters from proven partners with final assembly conducted in its own facilities, while sales growth is driven by educational courses for surgeons.

Silk Road Medical Inc (SILK): Price to Earnings Ratio from 07/04/2022 to 09/28/2024

Comprehensive metric breakdowns and analytics for silkroadmed.com (SILK)
- stock price and consensus target price:
General company analysis:Silk Road Medical, Inc. - SILK
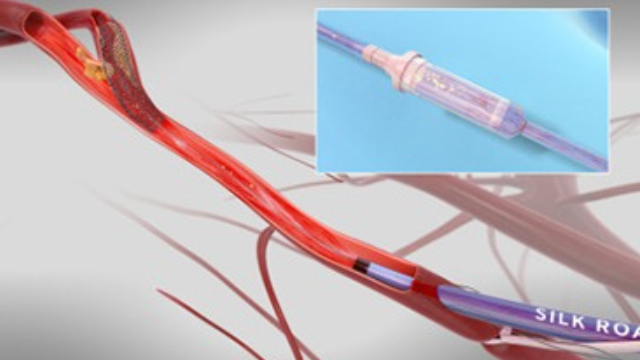
Manufactured product of Silk Road Medical, Inc

Silk Road Medical, Inc. (SILK) produces high-tech medical equipment, where capital intensity is coupled with stringent sterility and waste disposal standards. The P/E ratio determines the market value of a share relative to the company's annual net income. This indicator measures the investment payback period and the level of market expectations. Analyzing the issuer's P/E ratio allows for the timely identification of an overheated asset. This chart's price action helps investors accurately determine risk limits when purchasing a stake in the business.

Analysis of competing companies

Dexcom - Market Cap to Net Income|Price to Earnings Ratio PEN (Penumbra Inc)|NOVT - Market Cap to Earnings|Haemonetics Corp. - Price to Earnings Ratio|P/E Multiple Inspire Medical Systems, Inc. INSP|PRCT: Price to Earnings Ratio|CONMED - Market Price to Net Income Ratio|PLSE: P/E Multiple|INMD - Business Payback Period|Price to Earnings Ratio PMI|Price to Earnings Ratio Surmodics (SRDX)|Price to Earnings Ratio SENS (Senseonics Holdings, Inc.)|NPCE (NeuroPace Inc) - Company Value to Net Income|Price to Earnings Ratio Tactile Systems Technology TCMD|SNWV - Price to Earnings Ratio|outsetmedical.com - P/E Multiple|Market Cap to Earnings smartvest.com|LNSR: P/E Multiple|Price to Earnings Multiple RCEL|PROF (Profound Medical) - P/E Multiple|Baird Medical Investment (BDMD) - Business Payback Period|P/E Multiple EDAP|Price to Earnings Ratio Apyx Medical Corporation APYX|P/E Multiple ICCM (IceCure Medical Ltd.)|P/E Multiple Pulmonx Corporation LUNG|TELA - Price to Earnings Ratio|CTSO: Price to Earnings Ratio|SRTS (Sensus Healthcare, Inc.) - Price to Earnings Ratio|Zynex, Inc. - Company Value to Net Income|ECOR (electroCore Inc) - P/E Multiple|Market Cap to Earnings vicarioussurgical.com RBOT|Price to Earnings Ratio Inspira Technologies (IINN)|P/E Multiple SeaStar Medical Holding Corp (ICU)|IRIDEX Corp - Price to Earnings Ratio|P/E Multiple Intelligent Bio INBS|Beyond Air Inc - P/E Multiple|Business Payback Period Profusa Inc. PFSA|STRATA Skin Sciences, Inc. (SSKN) - Price to Earnings Ratio|Market Cap to Net Income GCTK (GlucoTrack Inc.)|Price to Earnings Ratio nanovibronix.com|Price to Earnings Ratio Venus Concept Inc. (VERO)|P/E Multiple NUWE|AEMD - Market Cap to Earnings|Price to Earnings Ratio asensus.com ASXC|AVGR: Price to Earnings Multiple|BSGM: Price to Earnings Ratio|Cutera, Inc. - Market Price to Net Income Ratio|Know Labs Corp (KNW) - Price to Earnings Ratio|NARI - Business Payback Period|NVRO (nevro.com) - P/E Multiple|Market Cap to Earnings reshapelifesciences.com RSLS