Net Margin: Fisker Corp (FSR)

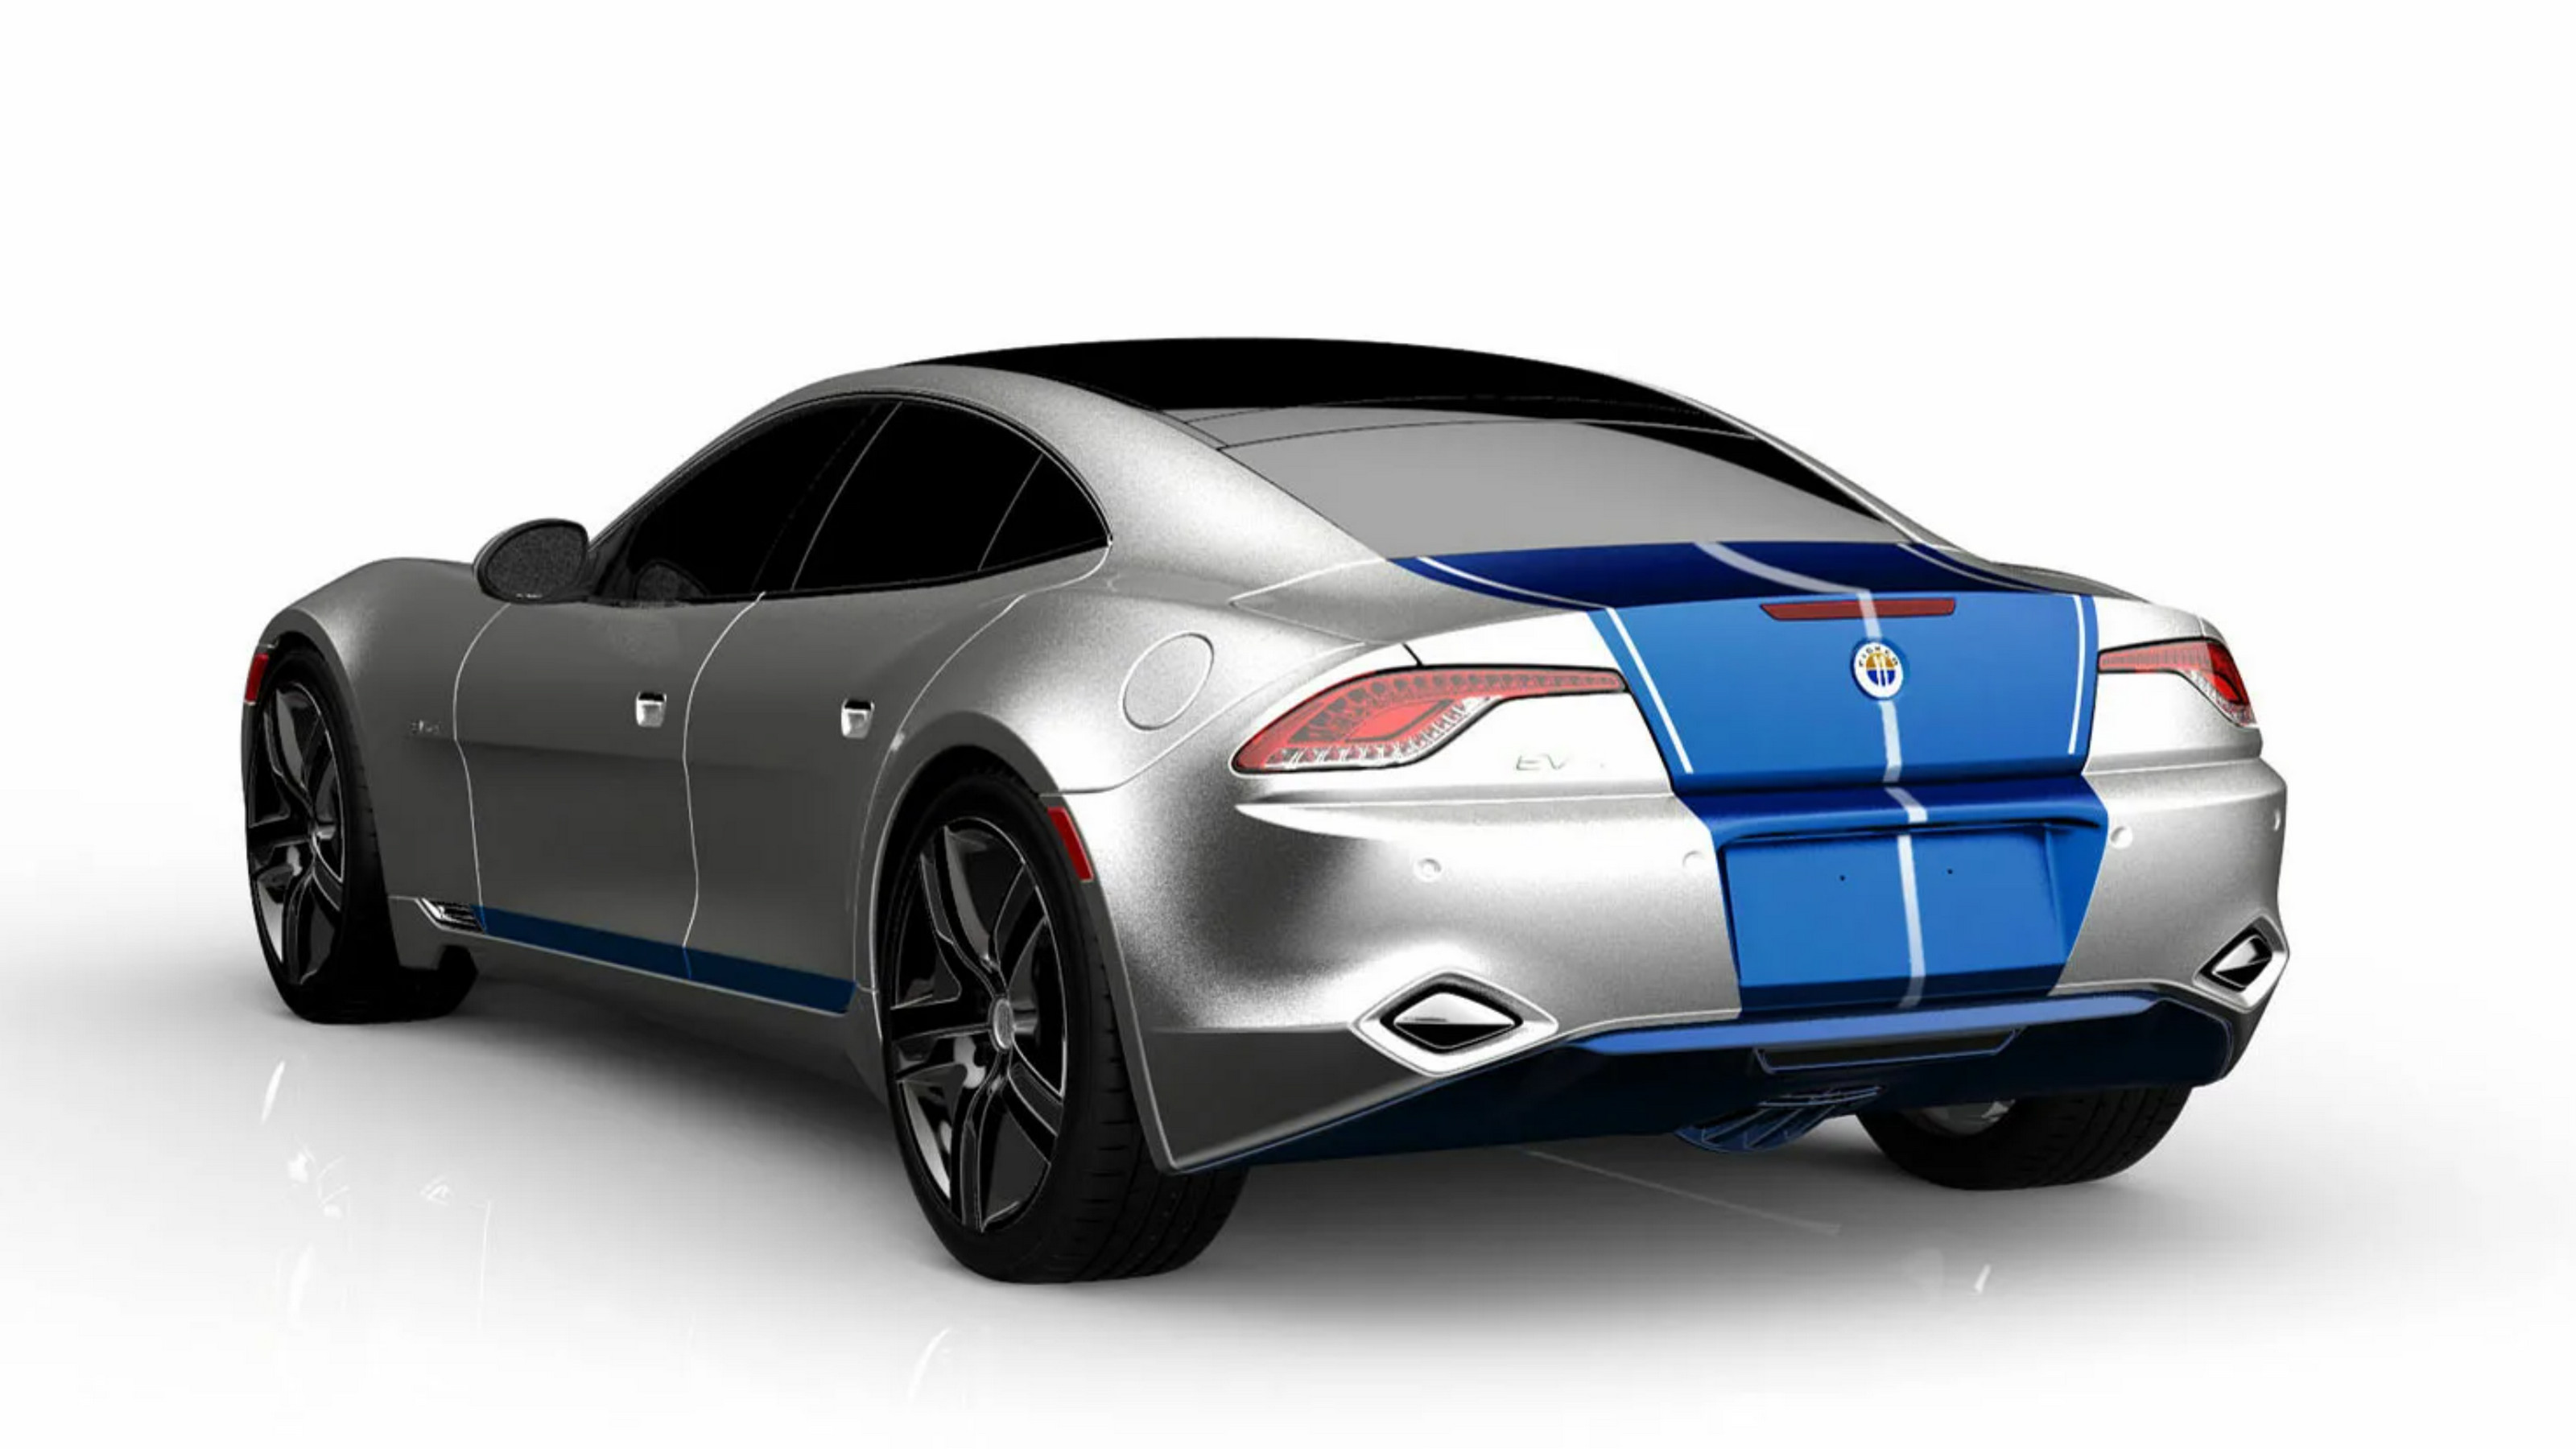
Symbol and logo of brand Fisker Automotive (FSR)

The bankruptcy and management collapse of Fisker Inc (FSR) have led to a complete loss of market confidence. This net sales margin chart confirms the collapse, where the value of -279.20 characterizes this level. Previously, the business relied on Ocean crossover sales and digital services, implementing ESG principles through the use of recycled materials and a commitment to carbon-neutral production.

Fisker Corp (FSR) - Return on Sales by Net Profit from 07/04/2022 to 04/06/2024

Summary analytical data breakdowns for Fisker Corp (FSR)
- share price and expert price forecast:
- company stock exchange capitalization indicators:
Summary company analytics:Fisker Corp - FSR
Manufactured product of Fisker Automotive

The long-term sustainability of Fisker Inc (FSR) depends on its ability to generate real profit from every vehicle sold. This metric measures the share of net income in total revenue, revealing the efficiency of cost management. The current net profit margin stands at -279.20, reflecting the financial burden on the business. Component shortages resulting from trade wars are increasing the cost of goods sold, which directly reduces this indicator. The decline in values confirms systemic difficulties with scaling production.

Analysis of competing companies

TSLA: Net Sales Margin|LI - Company Sales Margin|RIVN (Rivian Automotive) - Net Sales Margin|Net Return on Sales XPEV (Xiaopeng Motors)|Net Margin NIO Inc (NIO)|Net Sales Margin Joby Aviation (JOBY)|Net Margin Zeekr ZK|Company Net Profitability VFS (VinFast Auto Ltd.)|LCID - Net Margin|Net Profit Rate QS (QuantumScape Inc.)|PSNY (Polestar EV) - Return on Sales by Net Profit|Net Margin enovix.com (ENVX)|Net Margin Amprius|Net Margin EVgo EVGO|Net Sales Margin LOT|Microvast Holdings, Inc. - Net Return on Sales|LiveWire Group, Inc. - Return on Sales by Net Profit|SLDP - Return on Sales by Net Profit|Robo.ai Corp - Net Sales Margin|Company Sales Margin Hyliion Inc. HYLN|NIU: Net Sales Margin|Net Margin Electrovaya Inc (ELVA)|FFAI (ff.com) - Net Sales Margin|Net Return on Sales CHPT (ChargePoint Holdings)|Net Sales Margin ABAT|Net Margin NVX (NOVONIX)|Net Margin Blink Charging Corp BLNK|KNDI: Net Return on Sales|CBAK Tech - Net Sales Margin|Company Sales Margin Wallbox WBX|XCH: Net Sales Margin|Net Return on Sales JZXN|BEEM (Envision Solar) - Net Sales Margin|Return on Sales by Net Profit ZOOZ Power (ZOOZ)|Net Sales Margin CENN|SDST - Net Margin|Net Sales Margin GTEC (Greenland Technologies Holding Corp)|Sunrise New Energy Co., Ltd. (EPOW) - Net Margin|XOS: Return on Sales by Net Profit|DFLI (Dragonfly Energy Corp) - Net Return on Sales|WKHS: Net Sales Margin|Return on Sales by Net Profit Elong Power|Net Margin Sono Group NV|Return on Sales by Net Profit Fly-E Group, Inc. (FLYE)|Net Sales Margin STI|GreenPower Motor Company Inc. - Net Return on Sales|Net Margin U Power Ltd UCAR|Company Sales Margin Envirotech (EVTV)|Lobo EV Technologies Limited - Net Sales Margin|Nuvve Holding (NVVE) - Return on Sales by Net Profit|CJET: Net Sales Margin|Return on Sales by Net Profit NaaS Technology Corp|EZGO (EZGO Technologies) - Net Sales Margin|Return on Sales by Net Profit Bollinger Innovations (BINI)|Net Sales Margin SCAG|Return on Sales by Net Profit Thunder Power EV AIEV|Net Sales Margin ALLG (Allego NV)|Ayro, Inc. (AYRO) - Net Margin|FFIE: Return on Sales by Net Profit|GOEV: Net Margin|hyzonmotors.com (HYZN) - Net Margin|Net Margin thelionelectric.com (LEV)|Net Margin Mullen Automotive Inc|Net Margin Phoenix Motor Inc. PEV|Return on Sales by Net Profit SVMH (SRIVARU Holding Limited)|VLCN - Net Margin|Net Sales Margin ZAPP (Zapp Electric Vehicles Group Limited)