Fisker Corp (FSR): Market Capitalization-to-Revenue Ratio

Corporate company logo of Fisker Inc. (FSR)

The revenue valuation metric reflects the price action of Fisker Inc (FSR), where 0.20 serves as the current parameter value. Demand for products has vanished, and sales have ceased due to asset liquidation. Management failures in logistics and financial control triggered the collapse. Ultimately, the ambitious EV creator lost market confidence and filed for bankruptcy, despite the attractive design of its models.

FSR: Fisker P/S Multiple 07/04/2022 - 04/06/2024

Analytical breakdowns for Fisker Automotive (FSR)
- current quotes and average value forecast:
General company analysis:fiskerinc.com - FSR
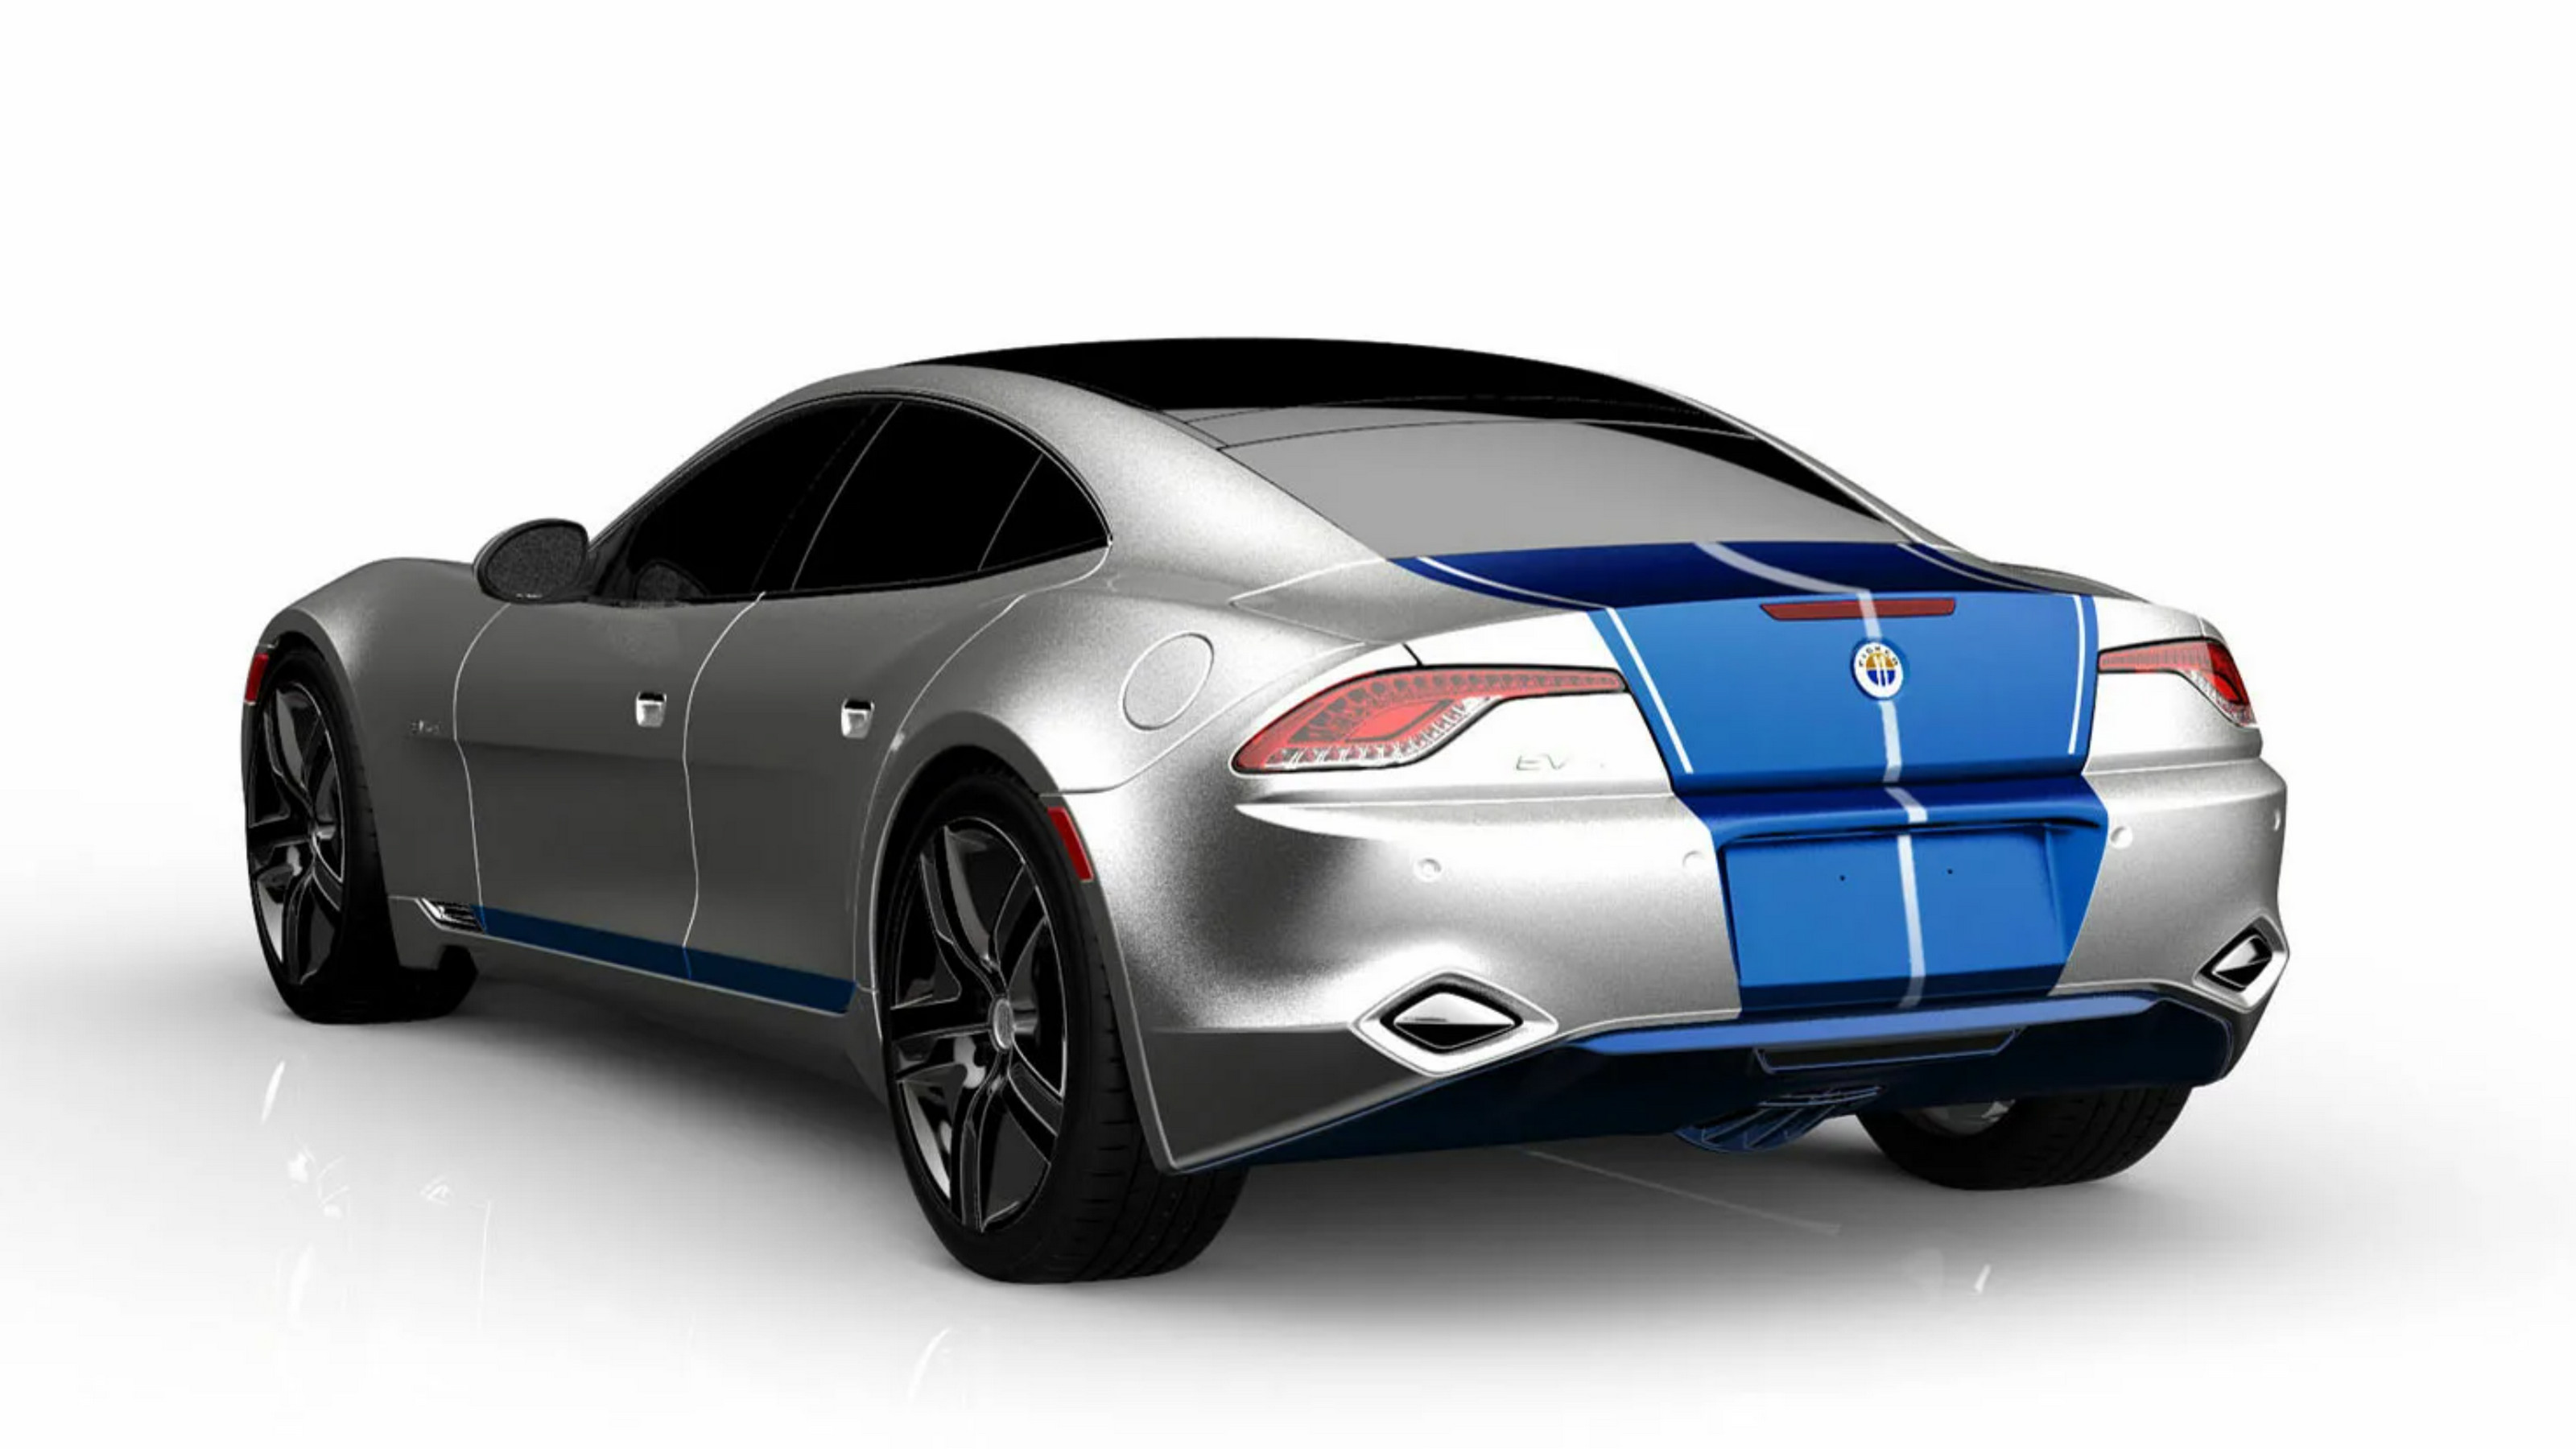
Manufactured products of Fisker Inc

For Fisker Inc (FSR), which is currently in liquidation and selling off remaining electric vehicle inventory below cost, the price-to-sales ratio serves as an indicator of market skepticism. This metric correlates market capitalization with current revenue, allowing investors to assess the premium paid for every dollar of sales amid the company's total loss of pricing power and operational collapse.

Competitors of Fisker Inc

TSLA - Price to Sales|Price-to-Revenue Ratio Li Auto LI|Market Capitalization-to-Revenue Ratio RIVN|XPEV: Market Cap to Revenue|Market Capitalization-to-Revenue Ratio NIO (NIO Inc)|JOBY: P/S Multiple|ZK - Price-to-Revenue Coefficient|Price-to-Revenue Ratio VinFast|Market Cap to Revenue Ratio LCID (Lucid Motors)|P/S Multiple QS|Market Cap to Revenue Polestar Corp PSNY|P/S Multiple ENVX (Enovix Corporation)|AMPX (amprius.com) - Price-to-Sales Ratio|EVGO - Price-to-Revenue Ratio|Price-to-Revenue Coefficient Lotus Technology Inc LOT|Microvast Holdings Inc (MVST) - Price-to-Revenue Ratio|LiveWire Corp - Market Capitalization-to-Revenue Ratio|SLDP (Solid Power, Inc.) - P/S Multiple|Price to Sales nwtnmotors.com AIIO|Price-to-Revenue Ratio Hyliion (HYLN)|Price-to-Revenue Ratio NIU (niu.com)|P/S Multiple ELVA (Electrovaya Corp)|Faraday Future Inc. (FFAI) - Price to Sales|ChargePoint Holdings - P/S Multiple|americanbatterytechnology.com (ABAT) - Market Cap to Revenue|NVX (novonixgroup.com) - Market Cap to Revenue|BLNK: Market Cap to Sales Volume|Price-to-Revenue Ratio Kandi Technologies Group, Inc.|CBAT: Market Capitalization-to-Revenue Ratio|P/S Multiple WBX|Price-to-Revenue Coefficient xcharge.com|P/S Multiple JZXN (Jiuzi Holdings)|BEEM - Market Cap to Revenue|ZOOZ Power, Ltd. - P/S Multiple|Price-to-Sales Ratio CENN|SDST: P/S Multiple|GTEC - Price-to-Revenue Coefficient|Price-to-Revenue Ratio Sunrise New Energy|Xos Trucks (XOS) - Price-to-Revenue Coefficient|Price-to-Revenue Ratio Dragonfly Energy Corp (DFLI)|P/S Multiple Workhorse Corp (WKHS)|P/S Multiple ELPW (Elong Power Holding)|sono-solar.com (SSM) - Price to Sales|FLYE - Price-to-Revenue Ratio|Market Capitalization-to-Revenue Ratio STI (Solidion Technology Inc.)|GP (greenpowermotor.com) - Market Cap to Revenue|U Power - Market Capitalization-to-Revenue Ratio|EVTV (Envirotech Vehicles Inc.) - P/S Multiple|Lobo EV (LOBO) - Price-to-Revenue Coefficient|Price-to-Revenue Ratio Nuvve (NVVE)|Chijet Motor Company Inc - Market Cap to Revenue Ratio|P/S Multiple NAAS (NaaS)|EZGO - Market Cap to Revenue|Bollinger - P/S Multiple|Price-to-Sales Ratio SCAG|tpev.com (AIEV) - Price-to-Revenue Ratio|ALLG - Price-to-Revenue Coefficient|Price-to-Revenue Ratio AYRO Inc.|FFIE: Market Capitalization-to-Revenue Ratio|P/S Multiple GOEV|HYZN - Price to Sales|Price-to-Revenue Ratio thelionelectric.com LEV|Mullen Automotive - Price-to-Revenue Ratio|Phoenix Motor Inc - P/S Multiple|Price to Sales SRIVARU|VLCN: P/S Multiple|Market Cap to Revenue Zapp Electric Vehicles Group Limited