MULN - Mullen Net Sales Margin

Public company logo of Mullen Automotive, Inc. (MULN)

Mullen Automotive, Inc. (MULN) demonstrates low scalability due to colossal infrastructure costs. Growth is hindered by stringent NHTSA requirements and the high capital intensity of its plants, as evidenced by the net profit margin, which currently stands at -4916.30. The company is currently focusing on modernizing assembly lines and reconfiguring workshops for the production of new commercial vans.

MULN: mullenusa.com Net Sales Margin 07/04/2022 - 07/28/2025

Analytical breakdowns for Mullen Automotive, Inc.
- share price and consensus valuation forecast:
Basic company analysis:Mullen Automotive, Inc.
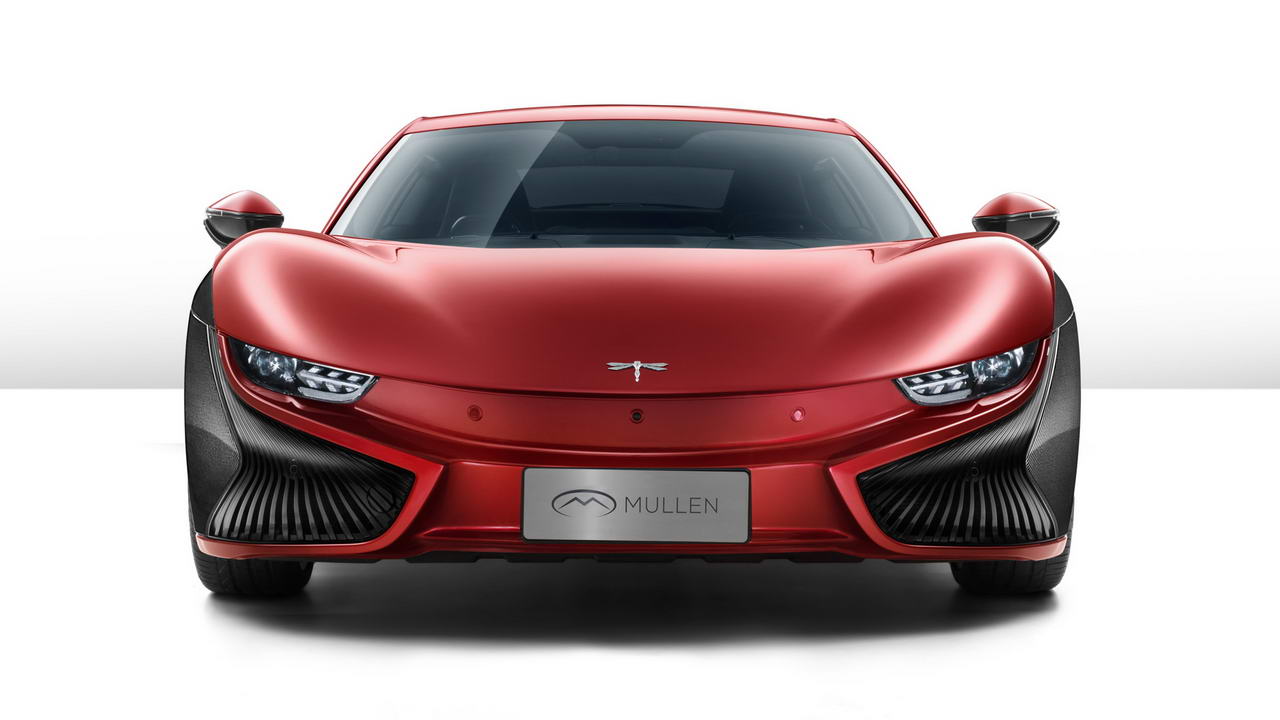
Manufactured product of Mullen Automotive Inc

This metric is calculated as the ratio of net income to total revenue, reflecting the efficiency of cost management. This metric determines the amount of profit generated from every dollar of sales, capturing the business's real-time assessment of operating expenses. For Mullen Automotive, Inc. (MULN), this is a critical marker of model viability amid the competition for the commercial electric vehicle segment. An analysis of the company's sales margins allows for an evaluation of how market pressure impacts profitability. The trend line reveals management's ability to curb inflation while scaling pre-orders.

Analysis of competing companies

TSLA: Net Sales Margin|LI - Company Sales Margin|RIVN (Rivian Automotive) - Net Sales Margin|Net Return on Sales XPEV (Xiaopeng Motors)|Net Margin NIO Inc (NIO)|Net Sales Margin Joby Aviation (JOBY)|Net Margin Zeekr ZK|Company Net Profitability VFS (VinFast Auto Ltd.)|LCID - Net Margin|Net Profit Rate QS (QuantumScape Inc.)|PSNY (Polestar EV) - Return on Sales by Net Profit|Net Margin enovix.com (ENVX)|Net Margin Amprius|Net Margin EVgo EVGO|Net Sales Margin LOT|Microvast Holdings, Inc. - Net Return on Sales|LiveWire Group, Inc. - Return on Sales by Net Profit|SLDP - Return on Sales by Net Profit|Robo.ai Corp - Net Sales Margin|Company Sales Margin Hyliion Inc. HYLN|NIU: Net Sales Margin|Net Margin Electrovaya Inc (ELVA)|FFAI (ff.com) - Net Sales Margin|Net Return on Sales CHPT (ChargePoint Holdings)|Net Sales Margin ABAT|Net Margin NVX (NOVONIX)|Net Margin Blink Charging Corp BLNK|KNDI: Net Return on Sales|CBAK Tech - Net Sales Margin|Company Sales Margin Wallbox WBX|XCH: Net Sales Margin|Net Return on Sales JZXN|BEEM (Envision Solar) - Net Sales Margin|Return on Sales by Net Profit ZOOZ Power (ZOOZ)|Net Sales Margin CENN|SDST - Net Margin|Net Sales Margin GTEC (Greenland Technologies Holding Corp)|Sunrise New Energy Co., Ltd. (EPOW) - Net Margin|XOS: Return on Sales by Net Profit|DFLI (Dragonfly Energy Corp) - Net Return on Sales|WKHS: Net Sales Margin|Return on Sales by Net Profit Elong Power|Net Margin Sono Group NV|Return on Sales by Net Profit Fly-E Group, Inc. (FLYE)|Net Sales Margin STI|GreenPower Motor Company Inc. - Net Return on Sales|Net Margin U Power Ltd UCAR|Company Sales Margin Envirotech (EVTV)|Lobo EV Technologies Limited - Net Sales Margin|Nuvve Holding (NVVE) - Return on Sales by Net Profit|CJET: Net Sales Margin|Return on Sales by Net Profit NaaS Technology Corp|EZGO (EZGO Technologies) - Net Sales Margin|Return on Sales by Net Profit Bollinger Innovations (BINI)|Net Sales Margin SCAG|Return on Sales by Net Profit Thunder Power EV AIEV|Net Sales Margin ALLG (Allego NV)|Ayro, Inc. (AYRO) - Net Margin|FFIE: Return on Sales by Net Profit|GOEV: Net Margin|hyzonmotors.com (HYZN) - Net Margin|Net Margin thelionelectric.com (LEV)|Net Margin phoenixmotorcars.com|SRIVARU Holding Limited (SVMH) - Company Sales Margin|Net Sales Margin VLCN|ZAPP (Zapp Electric Vehicles Group Limited) - Net Profit Rate|Net Sales Margin FSR (Fisker Inc.)