Installed Building Products (IBP) - Company Cash Volume

The cash liquidity chart demonstrates that the indicator stands at 0.42. Growth for Installed Building Products (IBP) is constrained by labor intensity and logistics, meaning expansion is driven by the acquisition of local players. Aggressive consolidation and centralized procurement enhance profitability, ensuring a stable cash flow. However, a heavy dependence on US homebuilding cycles creates structural risks for the company's financial results.

Analytical breakdowns and data insights for company installedbuildingproducts.com (IBP)
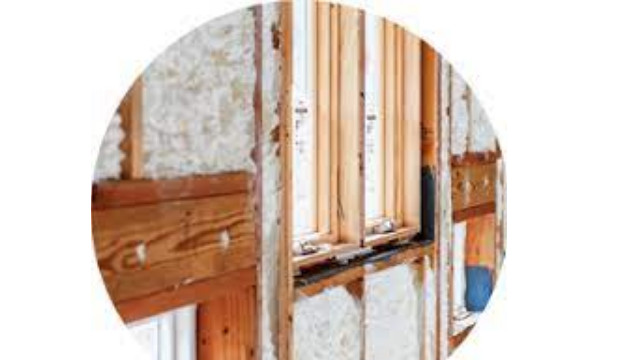
Scaling ESG standards and optimizing the logistics of thermal insulation materials require high operational flexibility from Installed Building Products (IBP). By analyzing the cash balance chart, an investor assesses the absolute volume of liquid reserves, allowing for an accurate calculation of risk ratios and the determination of the balance between the asset's financial stability and its return potential.
